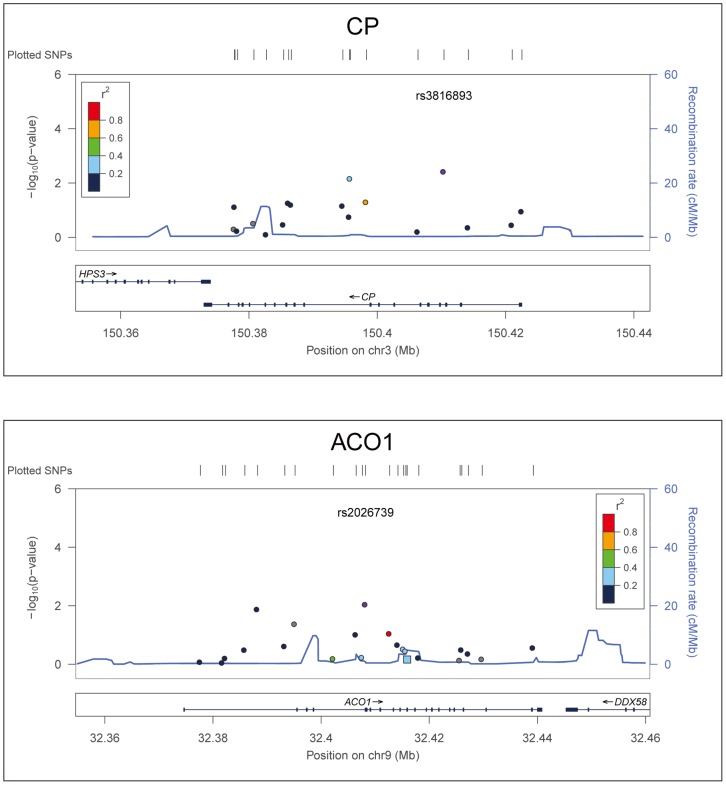
Figure 1. Representative Linkage Disequilibrium (LD) plot.
The LD plot for two representative SNPs that were statistically significantly associated with neuropathic pain in the CHARTER cohort is displayed: CP rs3816893 and ACO1 rs2026739. Each plot shows the degree of LD between the SNP of interest (rs number) and all other SNPs analyzed in the same gene, color-coded according to the r2 value (correlation of frequencies in this sample). The LD is based on HapMap Phase II CEU data. Association p-values are displayed on the y-axis and chromosomal distance (Mb) on the x-axis.

