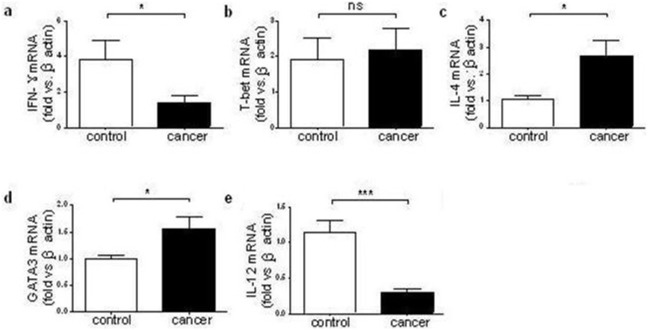
Figure 3. The mRNA level of each gene in PBMC from ECA patients and healthy controls.
The mRNA levels of IFN-γ (a), T-bet (b), IL-4 (c), GATA3 (d) and IL-12 (e) were determined by real-time PCR. Data were analyzed by the Student’s t-test. *P<0.05, ***P<0.001 vs. control group. NS, no significant difference. ECA, esophageal cancer; PCR, polymerase chain reaction; IFN, interferon; IL, interleukin. The patients and healthy controls used in this experiment had been matched with sex, age and number.

