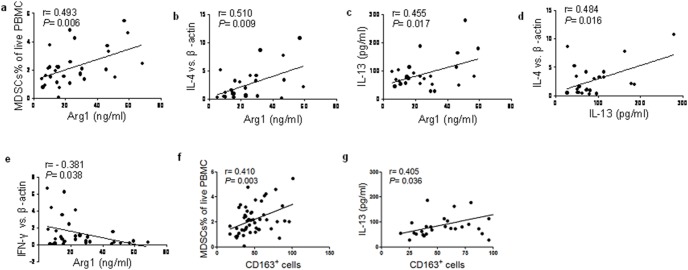
Figure 5. Correlation between cytokines and MDSCs as well as M2 macrophages in ECA patients.
A: Correlation between the plasma concentration of Arg1 and the percentages of circulating MDSCs in ECA patients. Positive correlation was found between Arg1 and MDSCs (r = 0.493, P = 0.006). b: Correlation between the plasma concentration of Arg1 and the mRNA level of IL-4 from ECA patients. Positive correlation was found between Arg1 and IL-4 mRNA (r = 0.510, P = 0.009). c: Correlation between the plasma concentrations of Arg1 and IL-13 from ECA patients. Positive correlation was found between Arg1 and IL-13 (r = 0.455, P = 0.017). d: Correlation between the mRNA level of IL-4 and plasma level of IL-13 from ECA patients. Positive correlation was found between IL-4 and IL-13 (r = 0.484, P = 0.016). e: Correlation between the mRNA level of IFN-γ and plasma level of Arg1 from ECA patients. Negative correlation was found between IFN-γ and Arg1 in ECA patients (r = −0.381, P = 0.038). f: Correlation between the number of CD163+ macrophages in cancer tissues and the percentages of circulating MDSCs in PBMC from ECA patients (r = 0.410, P = 0.003). g: Correlation between the number of CD163+ macrophages in cancer tissues and the plasma concentration of IL-13 from ECA patients (r = 0.405, P = 0.036).

