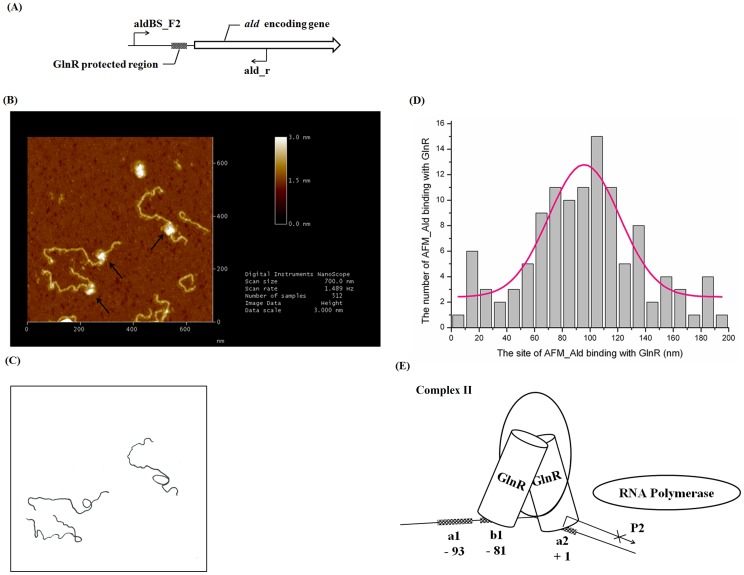
Figure 6. AFM analysis of the structural changes of ald promoter upon interaction with GlnR.
(A) Schematic presentation of ald promoter used for AFM visualizing. (B) AFM images of fragment AFM_Ald with GlnR. Putative DNA loops were marked with black arrows. (C) Sketch of AFM_Ald fragments in Figure 6B, highlighting possible DNA loops. (D) Histogram of the distribution of GlnR binding sites on fragment AFM_Ald (n = 223 DNA molecules). The Gaussian centered 97 nm with a standard deviation of 42 nm. (E) Proposed mechanisms for GlnR-mediated negative regulation of ald transcription. GlnR finally binds b1 and a2 sites to form Complex II and blocks ald transcription initiated from aldP2, which contributes the majority of ald transcripts under nitrogen-excess conditions. A DNA loop may occur during the process. The numbers labeled show their relative distance to aldP2 site.

