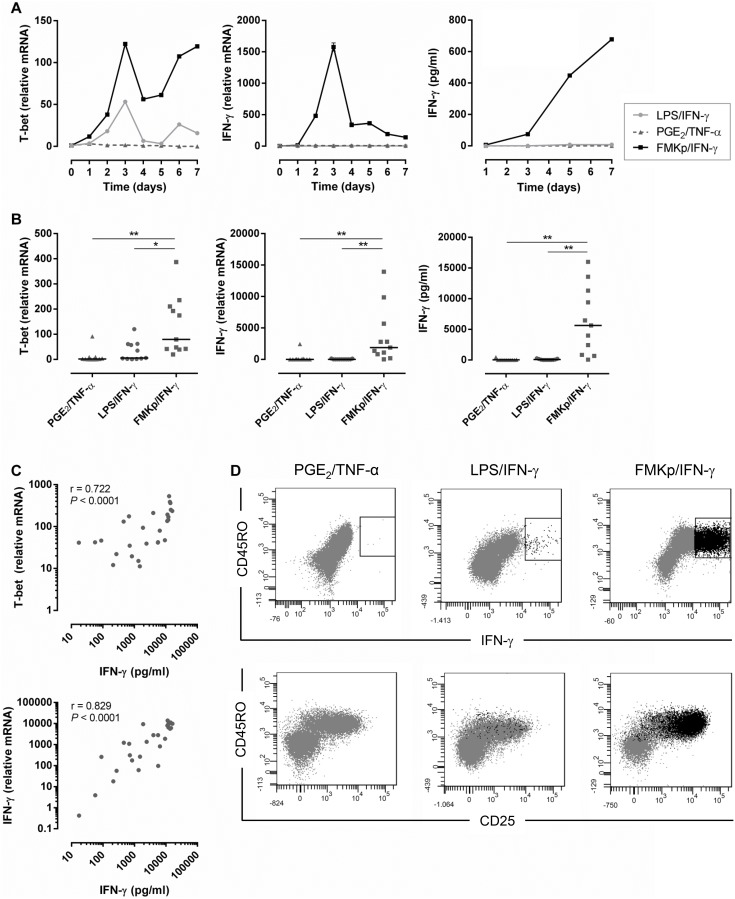
Figure 5. Differential Th1 polarizing capacity of differently matured DC.
Naive CD4+ T cells were co-cultured for 7 days with PGE2/TNF-α (dark gray triangle), LPS/IFN-γ (light gray circle) or FMKp/IFN-γ-(black square) matured DC. (A) Expression of T-bet and IFN-γ and production of IFN-γ were monitored. Graphs are representative of 11 independent experiments. (B) Comparison of the expression of T-bet and IFN-γ on day 5 and IFN-γ production on day 7 of differently matured DC cultured with naive CD4+ T cells. 11 independent experiments and their median levels are shown. Wilcoxon signed-rank test significance **P≤0.01, ***P<0.001 (C) Correlation between T-bet and IFN-γ expression on day 5 and IFN-γ secretion on day 7 of FMKp/IFN-γ-matured DC in co-culture with naive CD4+ T cells. Nonparametric Spearman correlation test significance indicated in the graphs. (D) Expression of CD45RO, CD25, and intracellular IFN-γ of naive CD4+ T cells cultured for 7 days with differently matured DC as indicated above the graphs. On day 6 GolgiPlug and GolgiStop were added to the co-culture and the staining was performed on day 7. Cells shown in the plots represent living singlet cells gated on CD3+CD4+ (dark gray population). T cells positive for IFN-γ are shown in black. Dot plots are representative graphs of 3 independent experiments.

