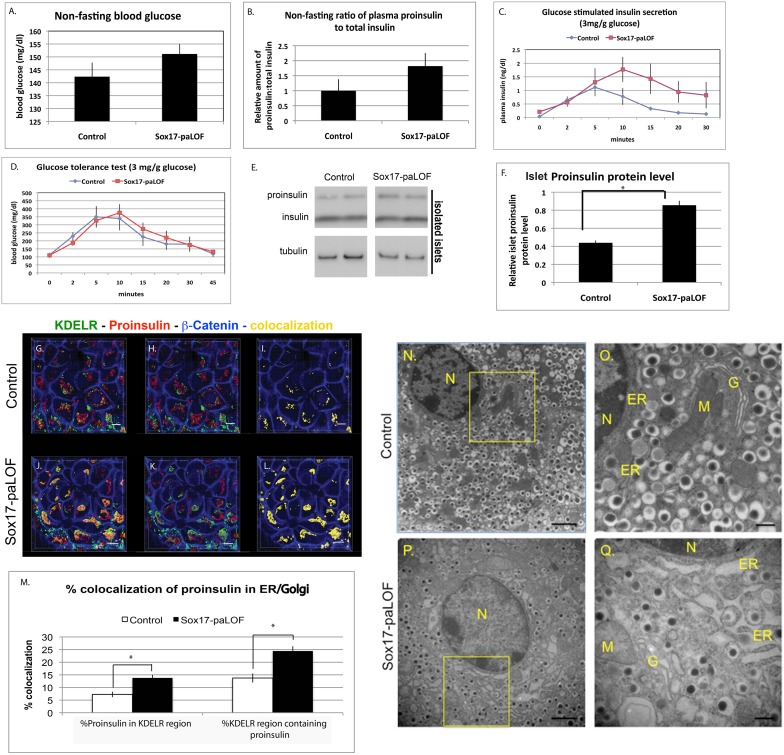
Figure 1. Sox17-paLOF results in proinsulin suβcellular localization and secretion changes and in the secretory organelles structural changes.
A, B) There were no statistically significant differences in non-fasting blood glucose levels and total plasma insulin levels between control and Sox17-paLOF mice. Control mice were Sox17fl/+, Sox17GFP/fl; Pdx1Cre;Sox17fl/+, n = 19 for glucose measurement, n = 18 for plasma insulin measurement; Sox17-paLOF mice were Pdx1Cre;Sox17GFP/fl and Pdx1Cre;Sox17fl/fl, n = 22 for glucose measurement, n = 20 for plasma insulin measurement. C) Glucose-stimulated insulin secretion showed higher trend of total plasma insulin level in Sox17-paLOF mice (Pdx1Cre;Sox17GFP/fl, n = 4) as compared to control mice (Sox17fl/+, n = 3). D) Glucose tolerance test showed similar glucose clearance (Control mice: Sox17fl/+, n = 4; Sox17-paLOF mice: Pdx1Cre;Sox17GFP/fl, n = 4). E) Analysis of isolated islets by western blot and subsequent quantification F) showed a significant increased in proinsulin protein in islets of Sox17-paLOF mice (asterisk shows p-value≤0.01). Control mice: Pdx1Cre;Sox17fl/+, n = 5. LOF mice: Pdx1Cre;Sox17fl/fl, n = 5. The western blot shows two representative examples. There was no difference in the islet insulin protein. G–L) Subcellular localization of proinsulin in mouse pancreatic β cells. Proinsulin levels were elevated in the secretory organelles as measured by proinsulin co-staining with the dynamic pre-Golgi and Golgi to the ER transport marker, KDELR. G and J showed staining of KDELR, Proinsulin, β-Catenin, and colocalization between KDELR and Proinsulin; H and K showed KDELR, Proinsulin, and β-Catenin only; I and L showed the colocalization pattern and β-catenin staining only. Proinsulin (red), KDELR (green), β-catenin staining of the cytoskeleton (blue), and colocalization between KDELR and Proinsulin is shown in yellow. Scale bar: 5 µm. M) Quantitation of percent ER and proinsulin colocalization using Bitplane Imaris software. The p-values (*) were ≤0.01 for Control (Sox17fl/+ and Sox17GFP/fl, n = 7–8) and Sox17-paLOF mice (Pdx1Cre;Sox17GFP/fl, n = 7). Between 6–10 islets were analyzed per mouse. N–Q) Analysis of β cells by transmission electron microscopy (TEM) indicated that the ER, Golgi (G), and mitochondria (M) were dilated in the Sox17-paLOF mice (Pdx1Cre;Sox17fl/fl, n = 3) relative to the Controls (Pdx1Cre;Sox17fl/+ (n = 3), Sox17fl/+, n = 2). N = nucleus. Black vesicles = insulin granules. Scale bar: 500 nm for N and P, 2 µm for O and Q.

