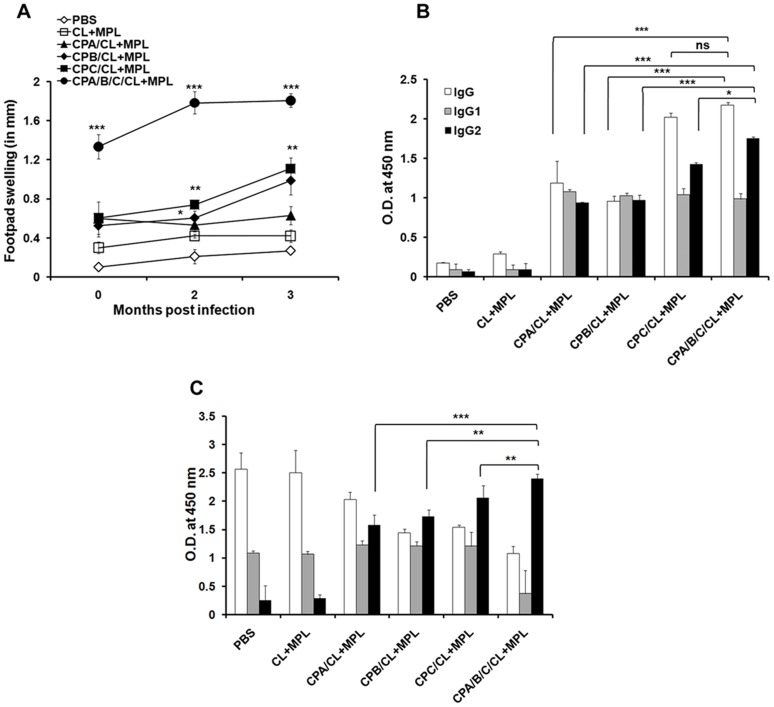
Figure 3. Pre and post challenge cellular and humoral responses in vaccinated hamsters.
A, DTH response before and after 2 and 3 months post infection. B, serum IgG, IgG1 and IgG2 at 10 days after final vaccination. C, IgG, IgG1 and IgG2 response after 3 months post infection. Data are presented as the mean absorbance at 450 nm ± S.E., ***, p<0.0001, ns = not significant. Asterisks over each bar indicate significant differences in comparison to adjuvant controls. Asterisks over line indicate significant differences between groups. *, p<0.05; **, p<0.01. The results are mean ± S.E. of five individual hamsters per group, representative of two independent experiments with similar results.

