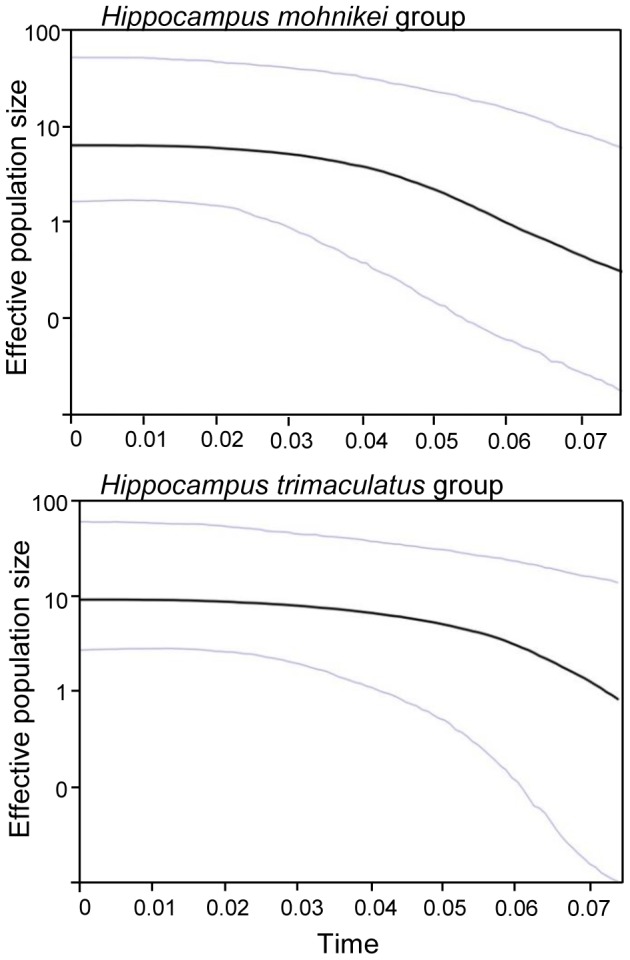
Figure 5. Bayesian skyline plots representing historical demographic trends of H. mohnikei and H. trimaculatus in China.

The mean estimate is enclosed within the 95% highest posterior densities.

The mean estimate is enclosed within the 95% highest posterior densities.