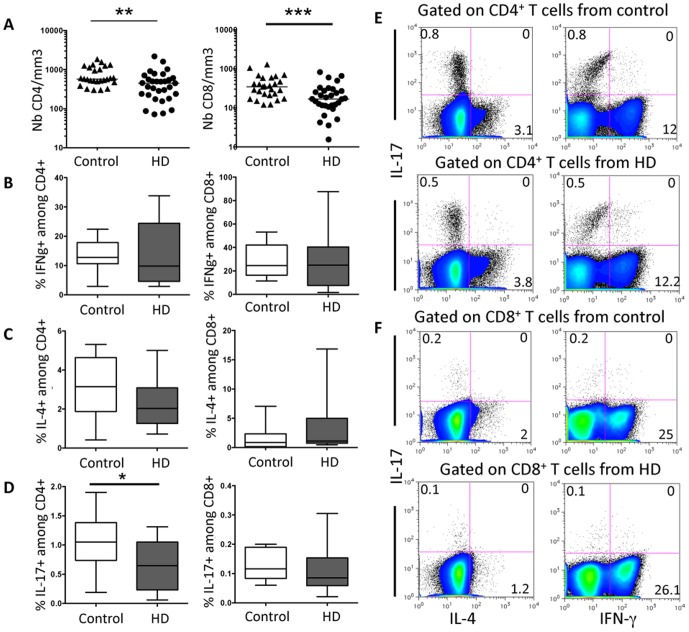
Figure 2. CD4+ and CD8+ T cell numbers are reduced in HD patients.
(A) CD4+ and CD8+T cell numbers are significant decreased in the peripheral blood of HD patients compared to healthy donors. Bars represent the median. (B) The percentage of IFNγ + cells among gated CD8+ or CD4+ T lymphocytes or (C) the percentage of IL-4+ and IL-17+ cells among gated CD4+ T lymphocytes was assessed after 6 h stimulation with PMA and ionomycin. Box-and-whisker plots are used to represent the distributions. The bottom and the top of a box represent the 5th and 95th percentiles, and the bar in the box shows the median. *, P<0.01; **, P<0.001; ***, P<0.0005 versus controls. Representative FACS analysis of IL-4, IL-17 and IFNγ production by gated CD4+ (E) or CD8+ (F) T cells from health donor controls (top) or HD patients (bottom) are represented.

