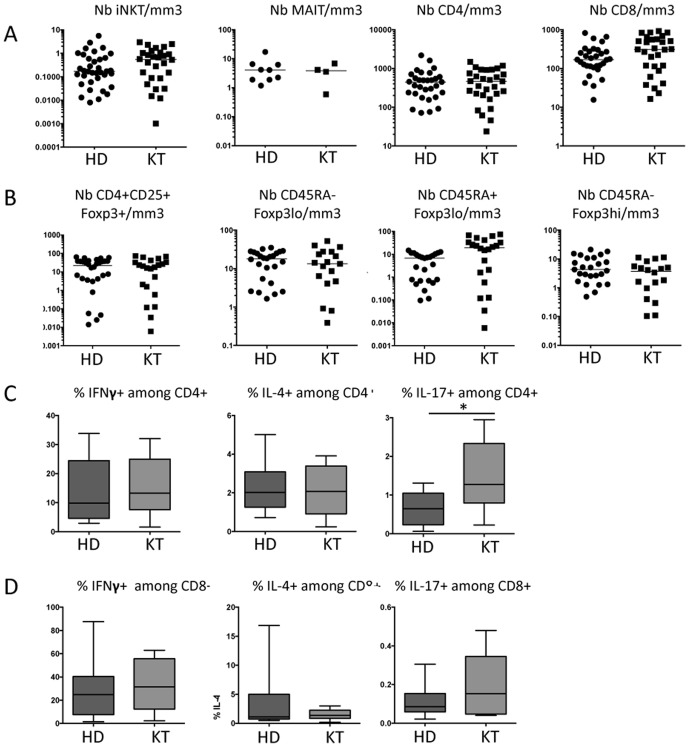
Figure 4. Both ILT and conventional T cells are equally deficient in HD and KD patients.
(A) HD patients had no significant differences in their number of iNKT, MAIT, CD4+ and CD8+ T cells when compared to kidney transplanted (KT) patients. Bars represent the median. (B) CD4+CD25+Foxp3+T cell numbers are similarly reduced in HD as in KD patients. Among these gated cells, cytokine-secreting CD45RA−Foxp3lo nonsuppressive, resting suppressive CD45RA+Foxp3lo and activated suppressive CD45RA−Foxp3hi cell levels, are also similar in HD and KD patients. (C and D) The percentage of IFNγ +, IL-4+ or IL-17+ cells among gated CD4+ (C) or CD8+ (D) T lymphocytes was assessed after 6 h stimulation with PMA and ionomycin. Box-and-whisker plots are used to represent the distributions. The bottom and the top of a box represent the 5th and 95th percentiles, and the bar in the box shows the median. (A and B) Bars represent the median. *, P<0.01.

