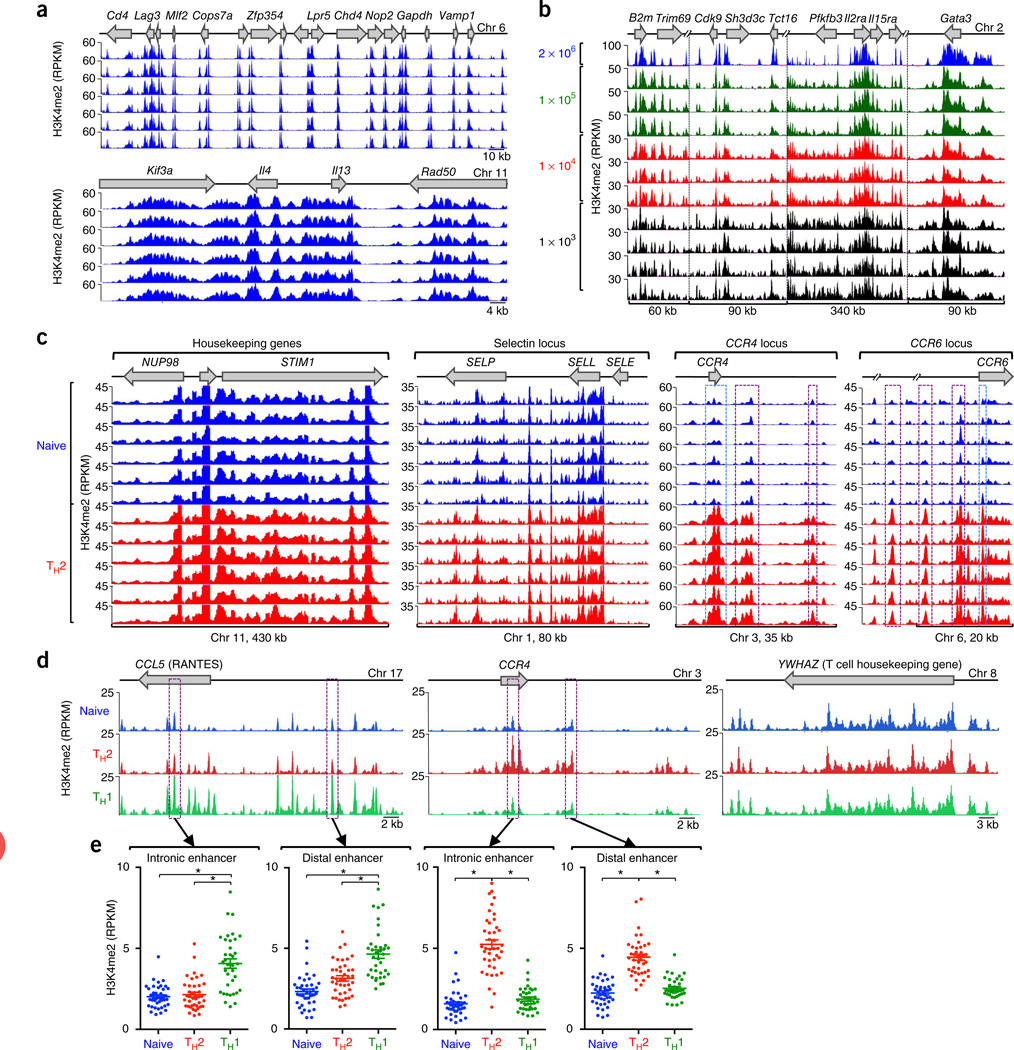
Figure 1.
Reproducibility, microscaling and sensitivity of the H3K4me2 ChIP-seq assay. (a) Standard ChIP-seq assays (2 × 10⁶ cells; six replicates) showing H3K4me2 enrichment patterns of the gene loci (top) in D10 cells. (b) Standard ChIP-seq assay (2 × 10⁶ cells) and micro-scaled ChIP-seq assay (105, 104 and 103 cell samples; 3–4 replicates) showing H3K4me2 enrichment patterns in D10 cells. (c) ChIP-seq analysis showing H3K4me2 enrichment patterns, for control regions STIM1, NUP98, SELP and SELL loci, nonexpressed SELE locus, and TH2 cell–type specific CCR4 and CCR6 loci, in the naive cells and TH2 cells of six healthy subjects. Significant H3K4me2 enrichment (exact test for negative binomial distribution, using edgeR integrated in Bioconductor package MEDIPS) across distal cis-regulatory elements and promoters in these loci are highlighted by purple and blue dashed-line boxes, respectively. (d) ChIP-seq analysis showing cell-specific H3K4me2 enrichment patterns, for CCL5 (TH1 cell–specific), CCR4 (TH2 cell–specific) and control region YWHAZ (no change), in naive, TH1 cells and TH2 cells. For each cell type, data were merged from all donors, including assay duplicates. (e) H3K4me2 enrichment values for a specific 500-bp window (highlighted in purple dashed line boxes in d). Each dot represents data from a single assay; error bars indicate mean ± s.e.m. *P < 1 × 10⁻⁶, exact test for negative binomial distribution (using edgeR integrated in Bioconductor package MEDIPS).

