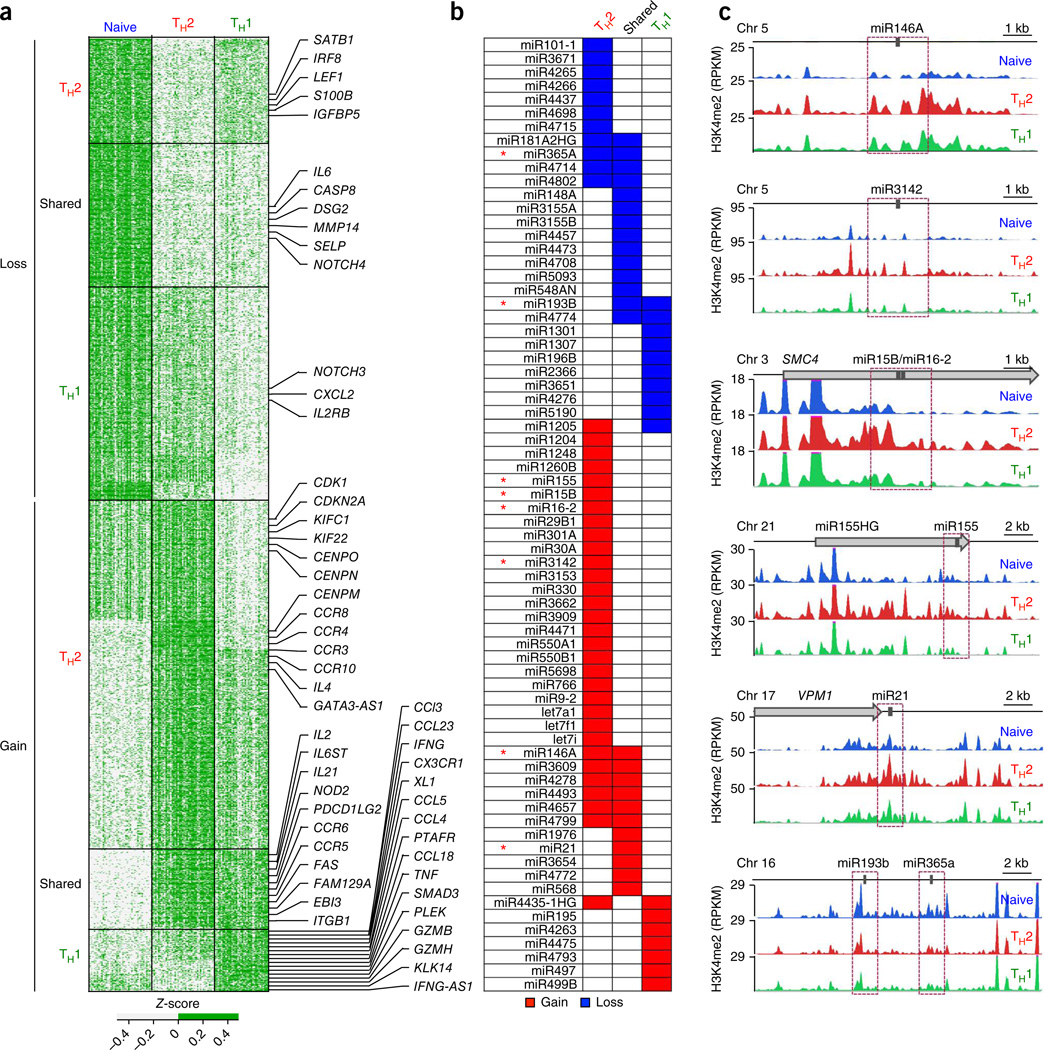
Figure 3.
Genes and pathways linked to differentiation of CD4+ memory cells. (a) Z-scores of normalized read counts for each unique promoter-localized DER (rows) obtained from any of the three pairwise comparisons of naive, TH2 and TH1 cells; to illustrate samples that are above or below the average across all samples per window (row), a two-color scale (see key) was used for Z-scores; data are from each independent ChIP-seq assay (n = 120) (columns). Promoter-localized DERs were classified into six groups based on gain or loss of H3K4me2 enrichment during differentiation of naive T cells into the TH2 cells or TH1 cells (Supplementary Table 3); in each group, the promoter-localized DERs were arranged by their chromosomal location (from the start of chromosome 1 to the end of chromosome Y); ‘shared’ denotes ‘shared memory enhancers’ that displayed equivalent H3K4me2 gain or loss in both TH2 cells and TH1 cells when compared to naive cells. Target genes of some promoter-localized DERs are shown to the right. (b) miRNAs that showed the strongest gain or loss of H3K4me2 enrichment in their promoter regions for the various DER subgroups. (c) miRNAs for which the H3K4me2 enrichment tracks for each cell type are shown, for indicated miRNAs (* in b). Purple dashed-line boxes indicate the promoter regions (TSS ± 1 kb) for each miRNA.

