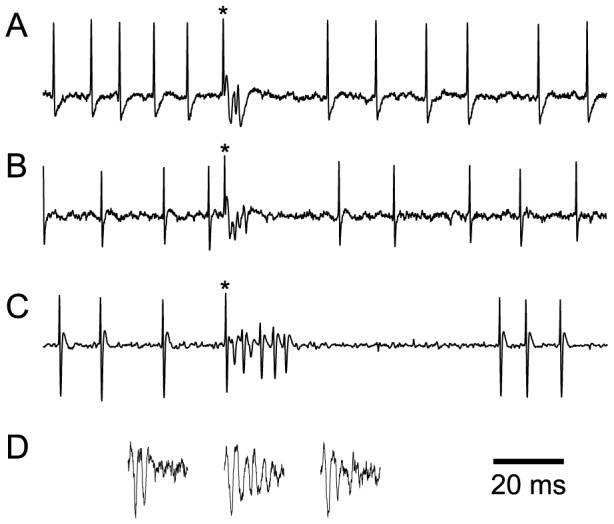
Figure 2. Extracellular recordings of PC activity.

(A–B) Sample recordings from zebrin localized PCs recorded under ketamine/xylazine (A) and urethane (B) that show both SSs and a CS (indicated by ‘*’). Note the pause in SSs following the CS. (C) Recording of PC from the zonal database displaying both SSs and a CS (indicated by ‘*’). Again note the pause in SSs following the CSs. The recording in C was filtered with a higher cutoff frequency for the high pass filter, eliminating the slower potential that can be seen in the recordings in (A and B), and on which the spikelets ride. (D) Extracellular traces showing three CSs from recorded from a PC with the electrode in the molecular layer, approximately 100 µm below the folial surface of crus 2a. Note how the number and size of the spikelets varies between CSs, but that the size and shape of the initial spike are nevertheless relatively constant, indicating that a single unit is being recorded.
