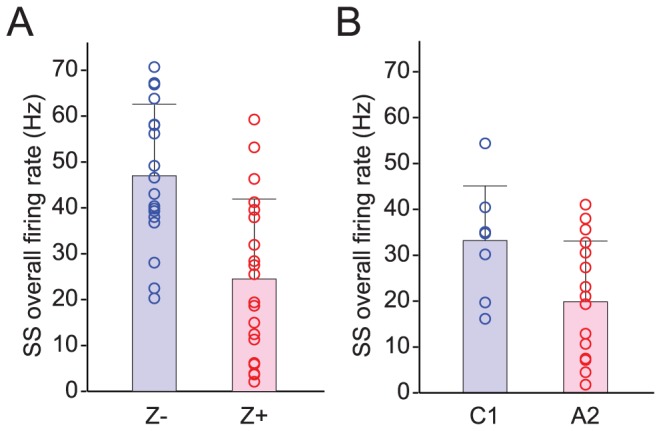
Figure 3. Z− PCs have higher SS firing rates.

The difference in SS firing rate is consistent for both histologically (A) and physiologically (B) located PCs. Circles represent the overall firing rates of individual PCs in Z− bands or C1 zone (blue) and in Z+ bands or A2 zone (red). In each distribution, the bar indicates the mean. Error bars indicate one SD of the distribution.
