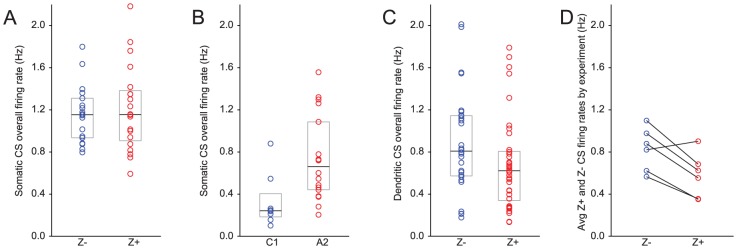
Figure 5. Variable relationship of CS firing rate to Z+ and Z− bands.

(A–C) Distribution of CS firing rates for Z− (or C1) and Z+ (or A2) cells. Circles represent the firing rates of individual PCs. In each distribution, the box indicates the 1st and 3rd quartile and the black line represents the median of the distribution. (A) Somatically recorded Z+/− PCs show comparable CS firing rate. (B) Somatically recorded PCs in C1 zone show significantly lower firing rates than those in A2 zones. (C) Dendritically recorded PCs in Z− bands had a higher median rate than Z+ bands despite the wide scatter of values within each type of band. (D) Median firing rates compared between Z+ and Z− bands within individual experiments. Each circle represents median CS firing rate for all Z− (blue) or Z+ (red) PCs from an individual experiment. Lines connect the Z+ and Z− cells obtained in the same experiment.
