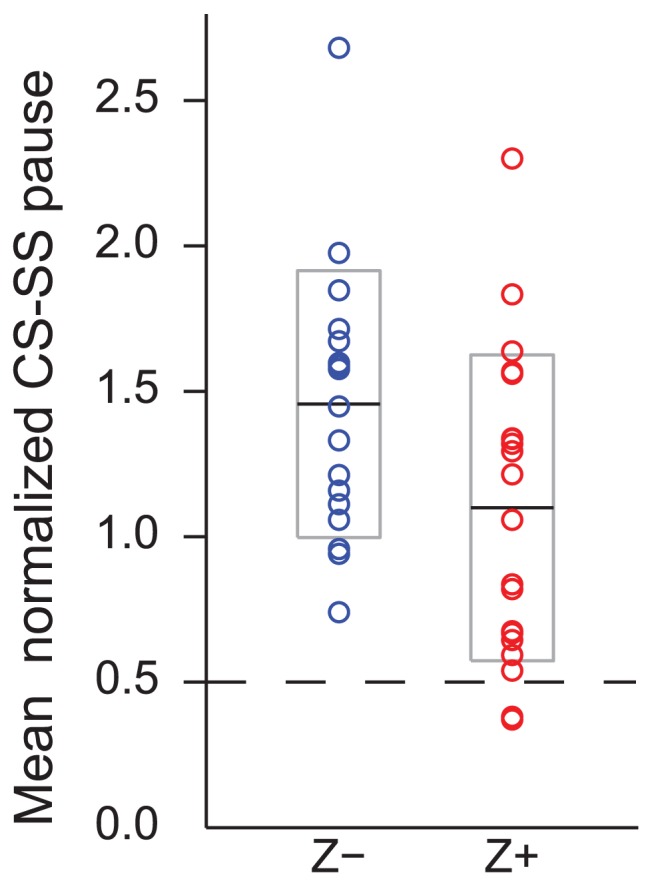
Figure 7. CSs in Z− bands cause a relatively stronger active suppression of SSs.

The mean SS pause duration of each PC was normalized by dividing by its mean SS ISI. The distribution of ratio is shown for Z+ and Z− PCs. Dashed line indicates the expected ratio if the latency from a CS to the first succeeding SS is solely a function of SS firing rate. The solid black lines indicate the overall median across each group, and the grey boxes indicate the range from 25% to 75% of each distribution.
