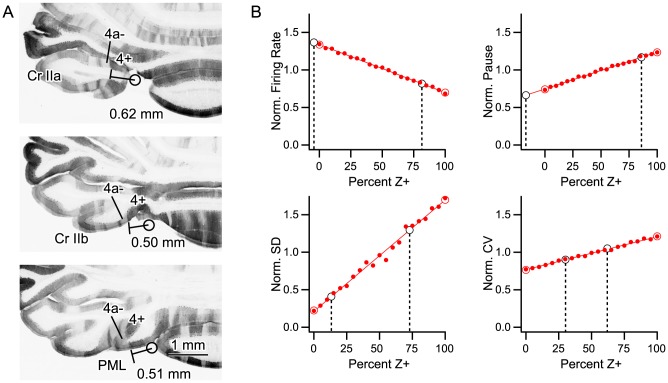
Figure 9. Zebrin composition of A2 and C1 zones.
(A) Anatomical estimate of zebrin bands for A2 and C1 zones in crus II and paramedian lobule. In horizontal sections on which the apical area of crus IIa, crus IIb, and paramedian lobules were seen, the distance between the putative position of the paravermal vein and the boundary between Z+ band 4+ and Z− band 4a− was measured. Circle indicates the putative position of the paravermal vein. This boundary roughly corresponded to the physiological boundary between A2 and C1 zones (0.6 mm, Methods). (B) Plots of normalized spike train parameters (firing rate, SS pause, SD of ISI, and CV of ISI) for populations consisting of different percentages of Z+ PCs. Simulated population averages indicated by filled small red circles. Values for experimental zebrin datasets indicated by large unfilled red circles (Z− at 0%, Z+ at 100%). Lines are least squares fits to the simulated population data. Large unfilled black circles show zonal data (C1 shown by left circle in each plot, A2 by right circle). Placement of black circles along x-axis was determined using the experimental parameter value in the corresponding regression equation, and thus provided an estimate of the percentage of Z+ PCs in the population (indicated by dashed black lines).

