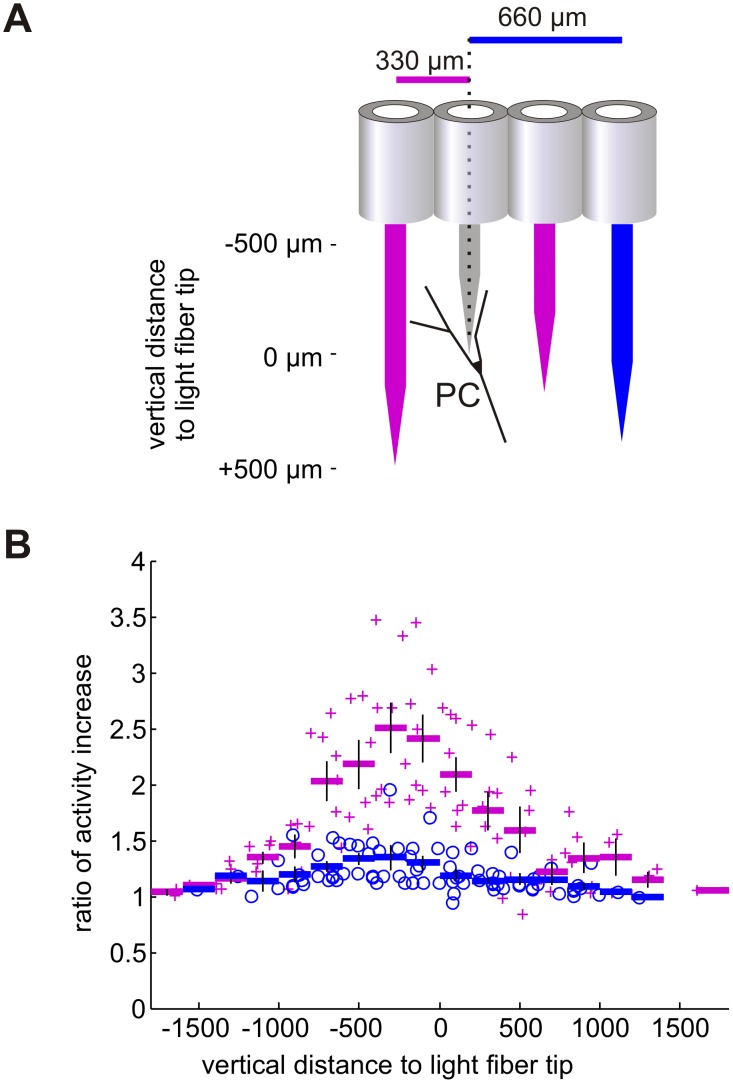
Figure 2. Light activation of PCs depends on the distance between the light source and the optogenetically targeted PC.
(A) Schematic diagram of the relative distance of the light guide (red or blue) and the recording electrode (gray) around and along a PC. The light fiber was moved during the recording from responsive PCs in vertical direction relative to the recording electrode and 1000 ms pulses of light were delivered in various depths at 250 µm intervals. Laser power was varied between 0.5 and 5 mW, resulting in 0.125 to 1.25 mW in front of light fiber. The PC response to light was recorded, while the glass fiber was either in 330 µm horizontal distance relative to recording electrode (red fibers) or in 660 µm horizontal distance (blue fiber). (B) Diagram of the dependence of relative increase of PCs activity on the vertical distance of the light fiber tip. For each light guide position, activity during light application is expressed as multiples of spontaneous activity of the particular PC. Data points are aligned relative to the depth of the light fiber; negative distances correspond to positions of the light fiber above the electrodes. Activity increase elicited by light fiber positioned in neighboring guide tube (330 µm distance) are marked by red crosses (data from 10 PC recorded in 3 mice), rate increase caused by the light fiber positioned in the subsequent guide tube (660 µm horizontal distance) are marked by blue circles (data from 11 PC recorded in 3 mice). Averages are calculated for 200 µm intervals and plotted as horizontal bars, vertical lines indicate standard error of the mean. Note that strongest responses were elicited when the light fiber tip was up to 500 µm above the recorded PC.

