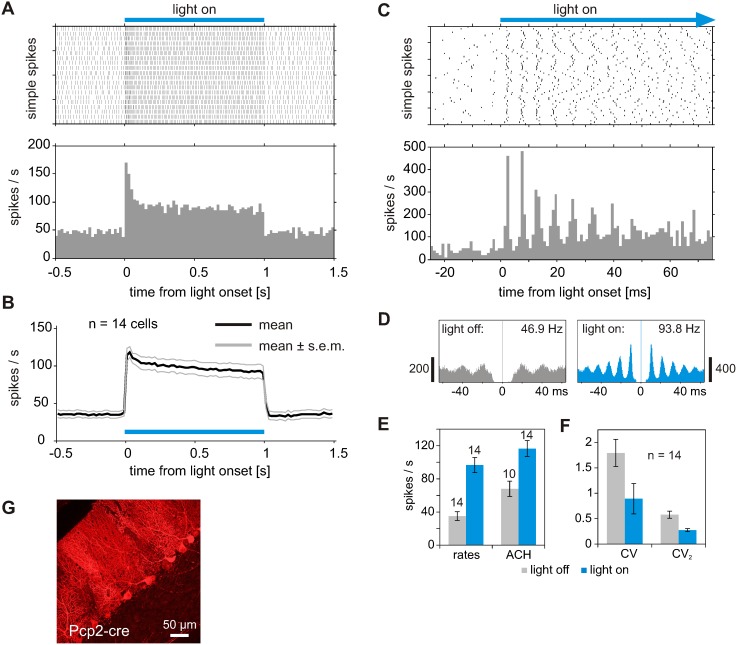
Figure 3. Activation of PC simple spikes during light activation of ChR2 specifically expressed in PCs.
(A) Raster plot (top) and peri-stimulus time histogram (PSTH, below) during light application to PCs. The raster plot exemplifies a single cell response during 20 light applications; the PSTH shows the averaged single cell response during these 20 repetitions (bin width 20 ms). (B) Average response profile of 14 cells, recorded from 6 tgPcp2-cre mice expressing ChR2 selectively in PCs. Illumination with 473 nm stably increases simple spike firing of PCs. Laser power was set between 1 and 5 mW, resulting in 0.25 to 1.25 mW in front of light fiber. (C) Same cell as in A, but PC responses to 60 light pulses plotted at faster timescale. In higher temporal resolution, rhythmic firing in single simple spike trains and in the PSTH becomes evident (bin width 1 ms). Note that the simple spikes are reliably triggered in less than 6 ms after light onset. Subsequent simple spikes appear with little temporal jitter, which diminishes the rhythmic modulation in the PSTH over time. (D) To analyze rhythmic firing during light driven and spontaneous activity, autocorrelation histograms (ACHs) were calculated on simple spike trains from periods without (gray) and with light application (blue), respectively. The rhythmic modulation is discernible in the autocorrelation of spontaneous activity (46.9 Hz), but becomes more prominent during light driven activity (93.8 Hz, modal frequency obtained from Fourier transformed of ACH). (E) Average firing rates increase during light application from 35 to 97 spikes/sec (left, n = 14). When spectra were computed from ACHs, modal frequencies were dominant in all 14 spectra obtained from light driven activity, but only in 10 spectra obtained from spontaneous activity. Modal frequencies shifted in average from 68.0 Hz (n = 10) to 116.6 Hz (n = 14, 40 to 100 light applications per cell). (F) The coefficient of variation (CV) is strongly diminished during light application, also indicating that simple spike firing becomes more regular. Similar effect is seen when CV2 is calculated from adjacent inter spike intervals. (G) Parasagittal section of cerebellar cortex from Pcp2-cre mouse after virus injection. Red fluorescence indicates expression of hChR2(H134R)-mCherry specifically in PCs.

