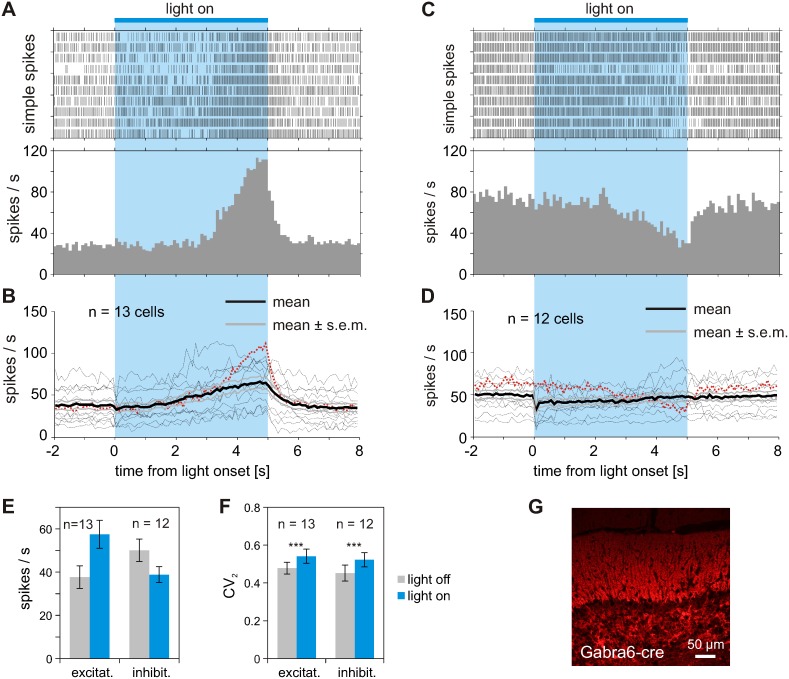
Figure 5. Multiple modes of modulation of PC simple spikes during light activation of ChR2 specifically expressed in GCs. Light activation of GCs results in inhibition and/or activation of PC simple spike activity.
(A) Increase in PC spike rate during 5 sec light activation of GCs expressing ChR2. Raster plots and corresponding PSTH from 10 repetitions (bin size 100 ms). (B) Average response profile of 13 PCs showing increased activity during the time course of prolonged light application to GCs expressing ChR2 (12 to 20 light applications per cell). Bold black line indicates mean time course of rate modulation averaged across 13 PCs. Dotted red curve corresponds to example shown in (A) above. (C) Inhibition of PC simple spikes during 5 sec light activation of GCs expressing ChR2. Data from cells shown in A and C are recorded simultaneously with two different electrodes. (D) Average response profile of 12 cells showing decreased activity during 5 sec of light application to GCs. Data recorded from 3 mice, 12 to 20 light applications per cell. Dotted red curve corresponds to example shown in (C) above. Laser power was set to 10 mW, resulting in 2.5 mW in front of light fiber. (E) Mean increase of simple spike rate from 13 PCs showing excitation during light application and mean decrease of activity of 12 PCs showing inhibition during light application. (F) Regularity of simple spike firing was increased during light application. The increase in CV2 values was similar in both subgroups and therefore independent of the overall change in activity during light application. (G) Parasagittal section of cerebellar cortex from Gabra6-cre mouse after virus injection. Red fluorescence indicates expression of hChR2(H134R)-mCherry specifically in GC somas and parallel fibers crossing the dendritic trees of PCs in the molecular layer.

