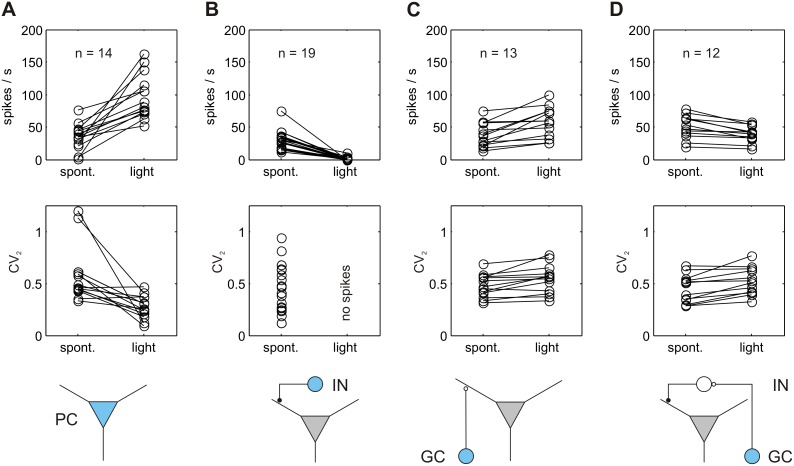
Figure 7. Comparison of PCs simple spike rate changes and spike regularity in response to light activation of PCs, MLIs and GCs.
(A) Increase in PC simple spike rate during ChR2 mediated light activation of PC in Pcp2-cre mice (14 cells from 6 mice). The increase in spike rates is paralleled by an increase in spike regularity, quantified by lower CV2 values. (B) Inhibition of simple spikes in PCs during one second ChR2 mediated light activation of MLIs in Gad2-cre mice (19 cells from 3 mice). As PCs were silent during light application, CV2 values were not calculated. (C) Overall increase in simple spike rate during prolonged ChR2 mediated light activation (5 sec) of GCs in Gabra6-cre mice. In 13 out of 25 cells, the PC simple spike rate increased after GC light activation. The increase in spike rate is not accompanied by higher regularity in the simple spike occurrence as CV2 values increased (D) Overall decrease in simple spike rate during prolonged ChR2 mediated light activation (5 sec) of GCs in Gabra6-cre mice. The regularity of the spikes is reduced, as indicated by higher CV2 values. Twelve out of 25 cells showed a decrease in PC simple spike rate after GC light activation. The 25 cells were recorded from 3 mice. The schematic representations in the bottom row plots depict (in blue) the loci of ChR2-expression in the different mouse lines and indicate the possible synaptic interaction mediating the light activated cell activity onto the PCs. (PC: Purkinje cell, IN: inhibitory interneuron, GC: granule cell).

