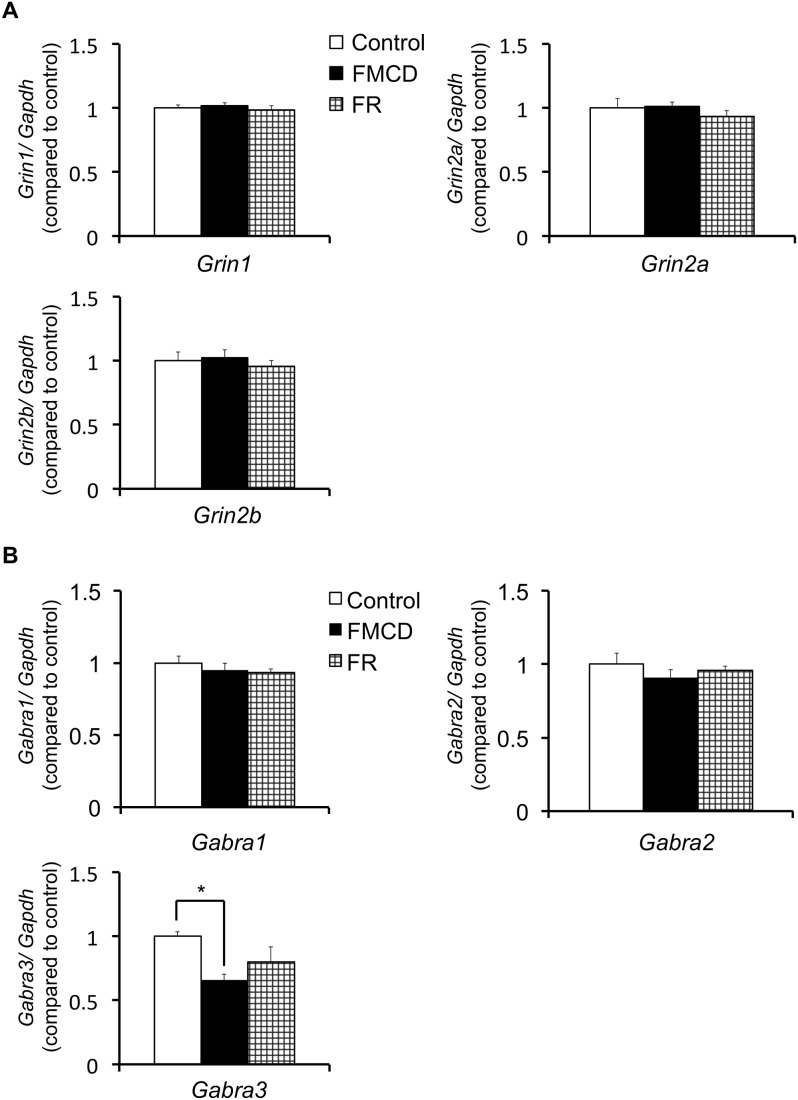
Figure 6. The effects of FMCD on gene expressions in the dorsal hippocampus in adult mice.
(A) Gene expressions of Grin1, Grin2a and Grin2b (Control, n = 5; FMCD, n = 5; FR, n = 5). (B) Gene expressions of Gabra1, Gabra2 and Gabra3 (Control, n = 4–5; FMCD, n = 5; FR, n = 5). The data represent the means ± SEMs. * indicates p<0.05, Control vs. FMCD.

