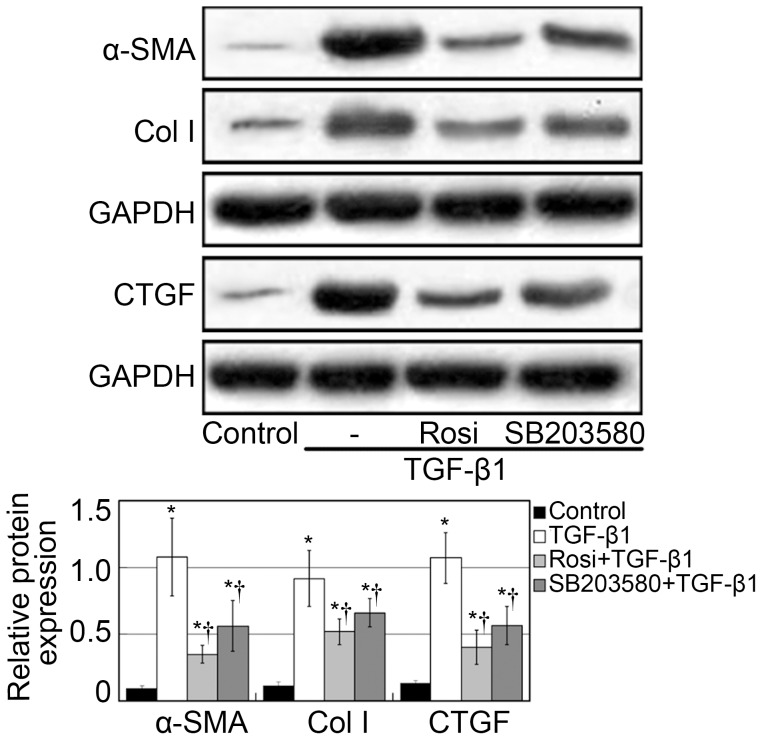
Figure 6. Rosiglitazone and SB203580 suppressed the protein expression of α-SMA, Col I, and CTGF.
Fibroblasts were treated with rosiglitazone for 2 h or SB203580 for 1 h. Next, the cells were incubated with 5 ng/mL TGF-β1 in the presence of rosiglitazone or SB203580 for 24 h (for CTGF analysis) or 48 h (for α-SMA and Col I analysis). Fibroblasts treated with vehicle control expressed little α-SMA, CTGF and Col I, TGF-β1 stimulation upregulated protein expression of α-SMA, CTGF and Col I (p<0.05, respectively). The p38 MAPK inhibitor SB203580 clearly suppressed the TGF-β1–induced α-SMA, CTGF and Col I expression at the protein levels (p<0.05). The expression of α-SMA, CTGF and Col I in rosiglitazone group was lower than that in SB203580 group (p<0.05). Quantification of western blot products was expressed as the ratio between the optical density of target protein band and GAPDH band (target protein/GAPDH). Each bar (mean) is the average of repetitions of three repeated experiments, and the error bars shown the standard deviation. Asterisk indicates p<0.05 compared with control group; Dagger indicates p<0.05 compared with TGF-β1 group.

