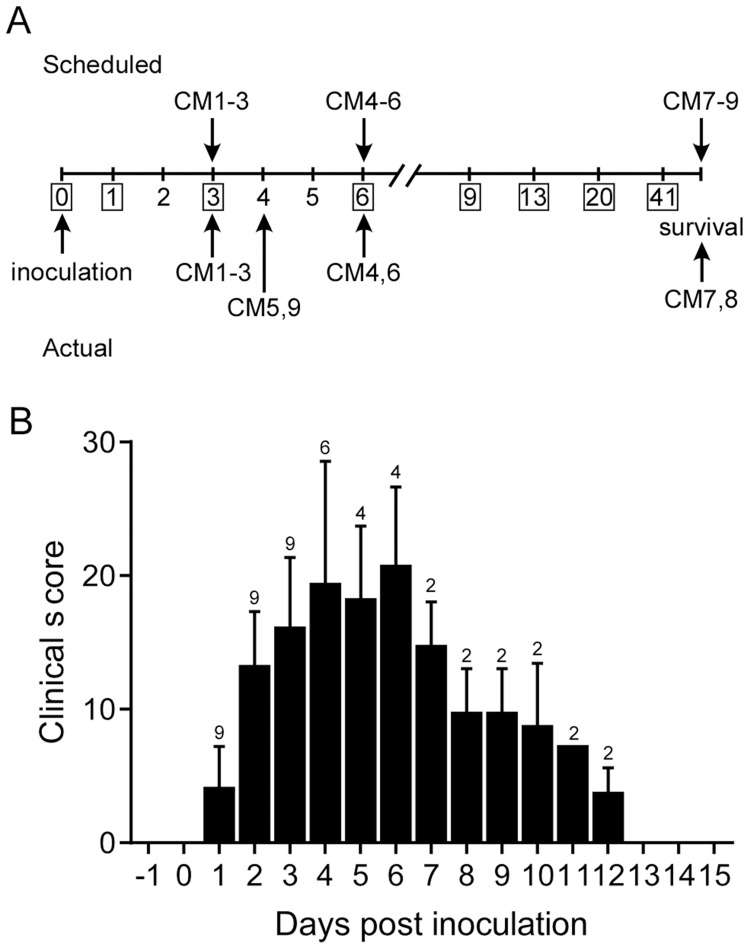
Figure 2. Experimental schedule and clinical parameters.
(A) Scheduled necropsies are indicated above and actual necropsies below the timeline. CM1–CM9 indicate the study animals. (B) Animals were scored daily and their mean clinical score ±SD calculated. The number of animals remaining in the experiment is indicated above the bar on each day.

