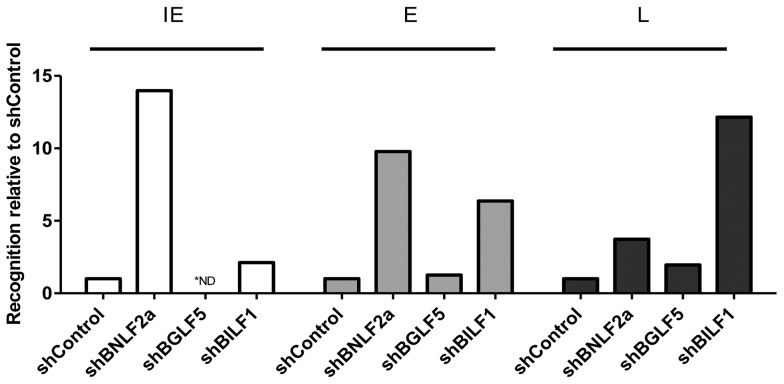
Figure 5. Direct comparison of the relative effects of BNLF2a, BGLF5 and BILF1 on T cell recognition of IE-YVL (BRLF1), E-GLC (BMLF1) and L-FLD (BALF4) epitopes.
Recognition of epitopes presented by each knockdown and control LCL was measured simultaneously. T cell recognition (IFN-γ release) was then normalised on the expression of each appropriate target mRNA transcript. Data are shown as recognition of knockdown LCLs relative to recognition of shControl LCLs. * For one target (IE-YVL in shBGLF5) expression of target transcripts was insufficient to assay, and no T cell recognition was observed, as indicated by ND.

