
FIGURE 7.
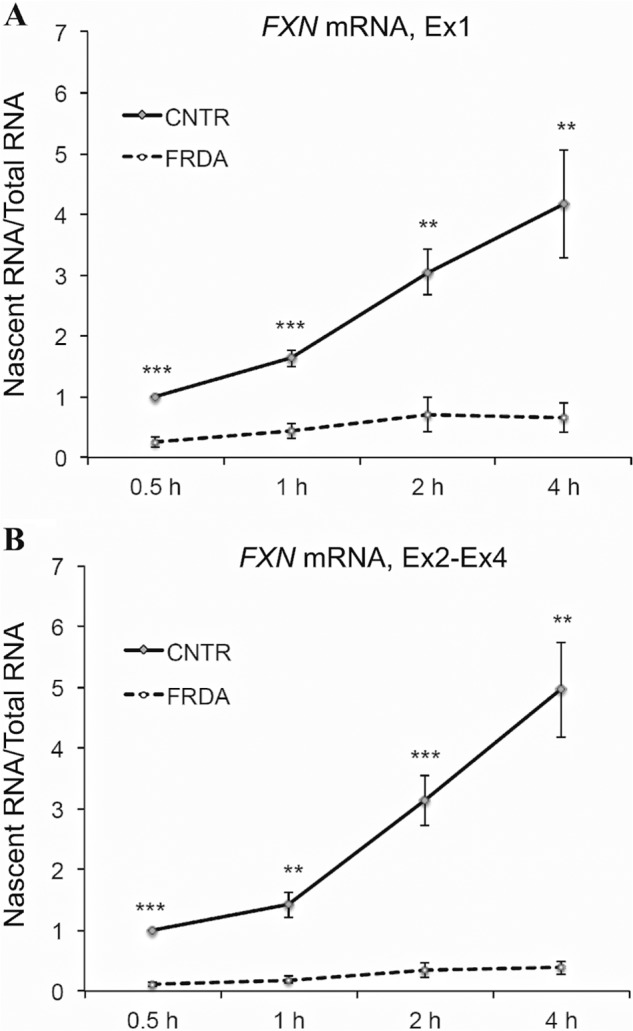
Metabolic labeling of nascent FXN transcript in living cells showing deficiency of transcriptional initiation in FRDA. A and B, quantitative RT-PCR of metabolically labeled nascent transcript for the indicated incubation times (0.5–4 h) is shown for FXN mRNA upstream (Ex1 region in Fig. 1A) and downstream (Ex2-Ex4 region in Fig. 1A) of the GAA-TR in intron 1. FRDA cells showed 5–12-fold less nascent FXN mRNA compared with non-FRDA cells (CNTR) at all time points assayed. Graphs represent the cumulative data from two complete experiments using two FRDA and two non-FRDA (CNTR) lymphoblast cell lines, each assayed in triplicate. Error bars represent ± S.E. **, p < 0.01; ***, p < 0.001.