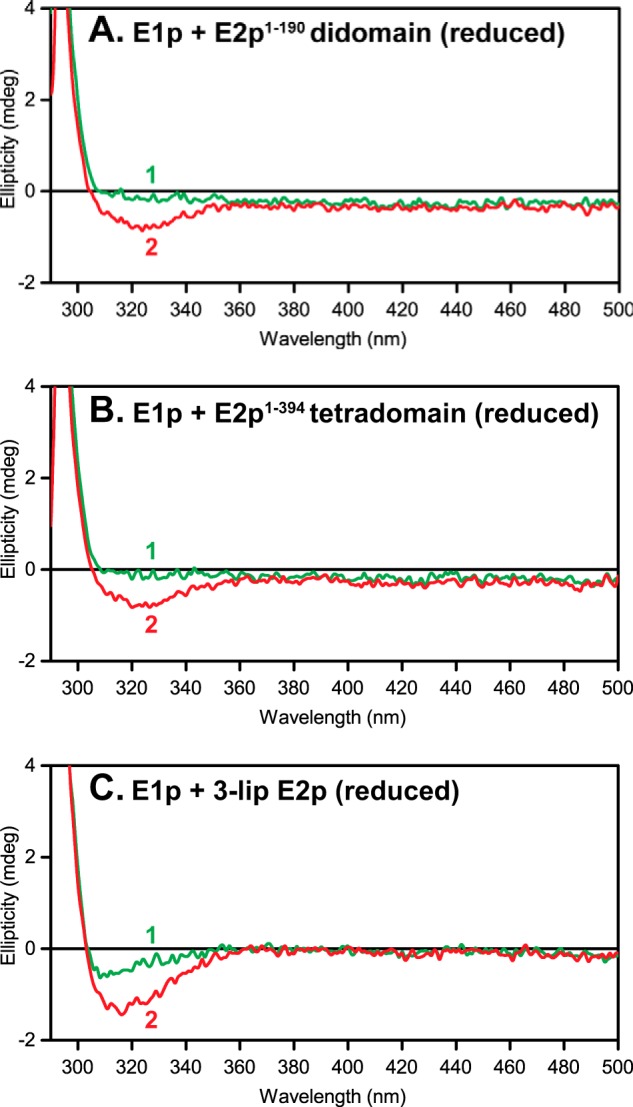
FIGURE 8.

CD spectra of apo-E1p in the presence of C-terminally truncated E2p proteins and 3-lip E2p. A–C, spectrum 1, apo-E1p (3 mg/ml or 30 μm active centers) + E2p proteins + TCEP (60 μm) but no ThDP added. Spectrum 2, same as spectrum 1 upon the addition of 0.3 mm ThDP. Other conditions are as described in the legend to Fig. 7.
