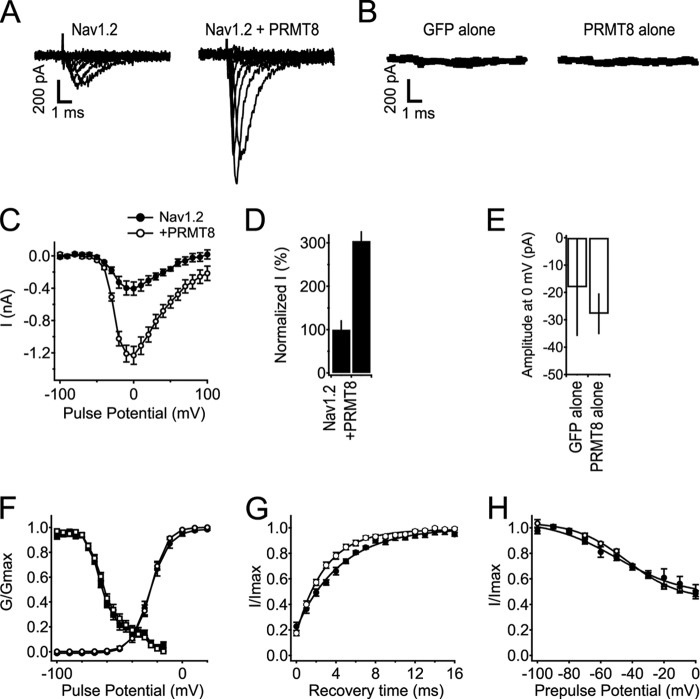
FIGURE 7.
Coexpression of PRMT8 increases Nav1.2 currents without effects on voltage-dependent properties. A, representative families of Nav1.2 current without and with coexpression of PRMT8. Currents in response to steps from −100 to +100 mV in 20-mV increments are shown. B, average currents from tsA-201 cells expressing GFP alone or PRMT8 alone at 0 mV, n = 5 for each. C, mean current-voltage (I-V) relationships of peak currents. Currents were elicited in response to voltage steps to the indicated potentials in 10-mV steps from a holding potential of −100 mV. Peak current is plotted as a function of test pulse potential. Note that the y axis is in nA. D, percentage change in peak amplitude of Nav1.2 current at 0 mV associated with coexpression of PRMT8. E, average of maximal inward currents from tsA-201 cells expressing GFP alone or PRMT8 alone at 0 mV. Note that the y axis is in pA. F, voltage dependence of the activation and voltage dependence of fast inactivation for cells expressing Nav1.2 alone or with coexpression of PRMT8. Conductance-voltage relationships (circles) were determined from I-V relationships as in B as G = I/(V − VRev), where V is the test potential, and VRev is the extrapolated reversal potential. The voltage dependence of inactivation (squares) was determined using 100-ms-long prepulses to the indicated potentials, followed by a test pulse to 0 mV. Normalized peak test pulse current is plotted as a function of prepulse potential. G, recovery from fast inactivation. Nav1.2, τ = 4.59 ± 0.289 ms, n = 10; Nav1.2 + PRMT8, τ = 3.05 ± 0.284 ms, n = 12; p = 0.001. H, voltage dependence of slow inactivation (Nav1.2, n = 6; Nav1.2 with PRMT8, n = 10). Error bars, S.E.

