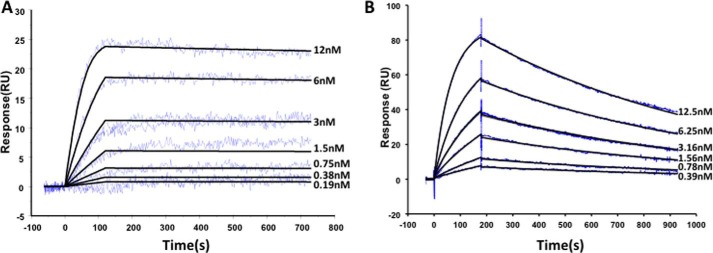
FIGURE 2.

Kinetic evaluation of the avian scFvs with their respective protein antigens. Both scFv were analyzed in a HA capture configuration, which oriented the scFv on the surface of the sensor chip. A, scFv180 was analyzed on a Biacore 4000™. The flow cell (FC) contained 5 spots; spots 1 and 5 were active (anti-HA + scFv + cTnI), spots 2 and 4 were control spots (anti-HA + cTnI), and spot 3 was an activated-deactivated surface control. Each was independently monitored, the sensorgrams double reference-subtracted (spot 1–2 and 5–4 and a buffer only control), and the 3 nm concentration was carried out in duplicate. B, scFvB8 was analyzed on a Biacore 3000™. FC 1 and 2 were functionalized with the anti-HA capture antibody. Purified scFv was captured on FC 2 only and PSA passed over FC 1 and 2. The sensorgrams were FC2–1 and double (buffer) reference-subtracted, and the 3.16 nm concentration was carried out in duplicate. Three independent analyses were carried out, and kinetic constants are reported ± standard error (Table 1). RU, response units.
