
FIGURE 9.
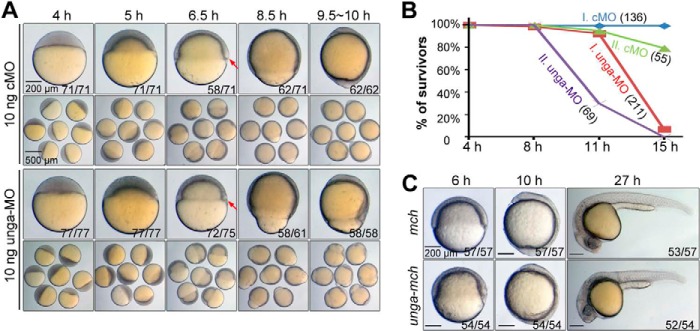
Effects of unga knockdown and overexpression on embryonic development. A, morphology of embryos. Embryos were injected with 10 ng of cMO or unga-MO at the one-cell stage and imaged individually (top panel) or in a group (bottom panel) at indicated stages. Individual embryos were viewed laterally with dorsal to the right if the dorsal side was distinguishable. The ratio of embryos with representative morphology is indicated in the right corner. The embryonic shield is indicated by an arrow. B, surviving rates of embryos at different time points of development. Data from two independent experiments (I and II) are shown with the number of embryos at 4 hpf in parentheses. C, morphology of embryos injected with 500 pg of mcherry (mch) mRNA or unga-mcherry (unga-mch) mRNA at the indicated stages. The ratio of embryos with representative morphology is indicated.