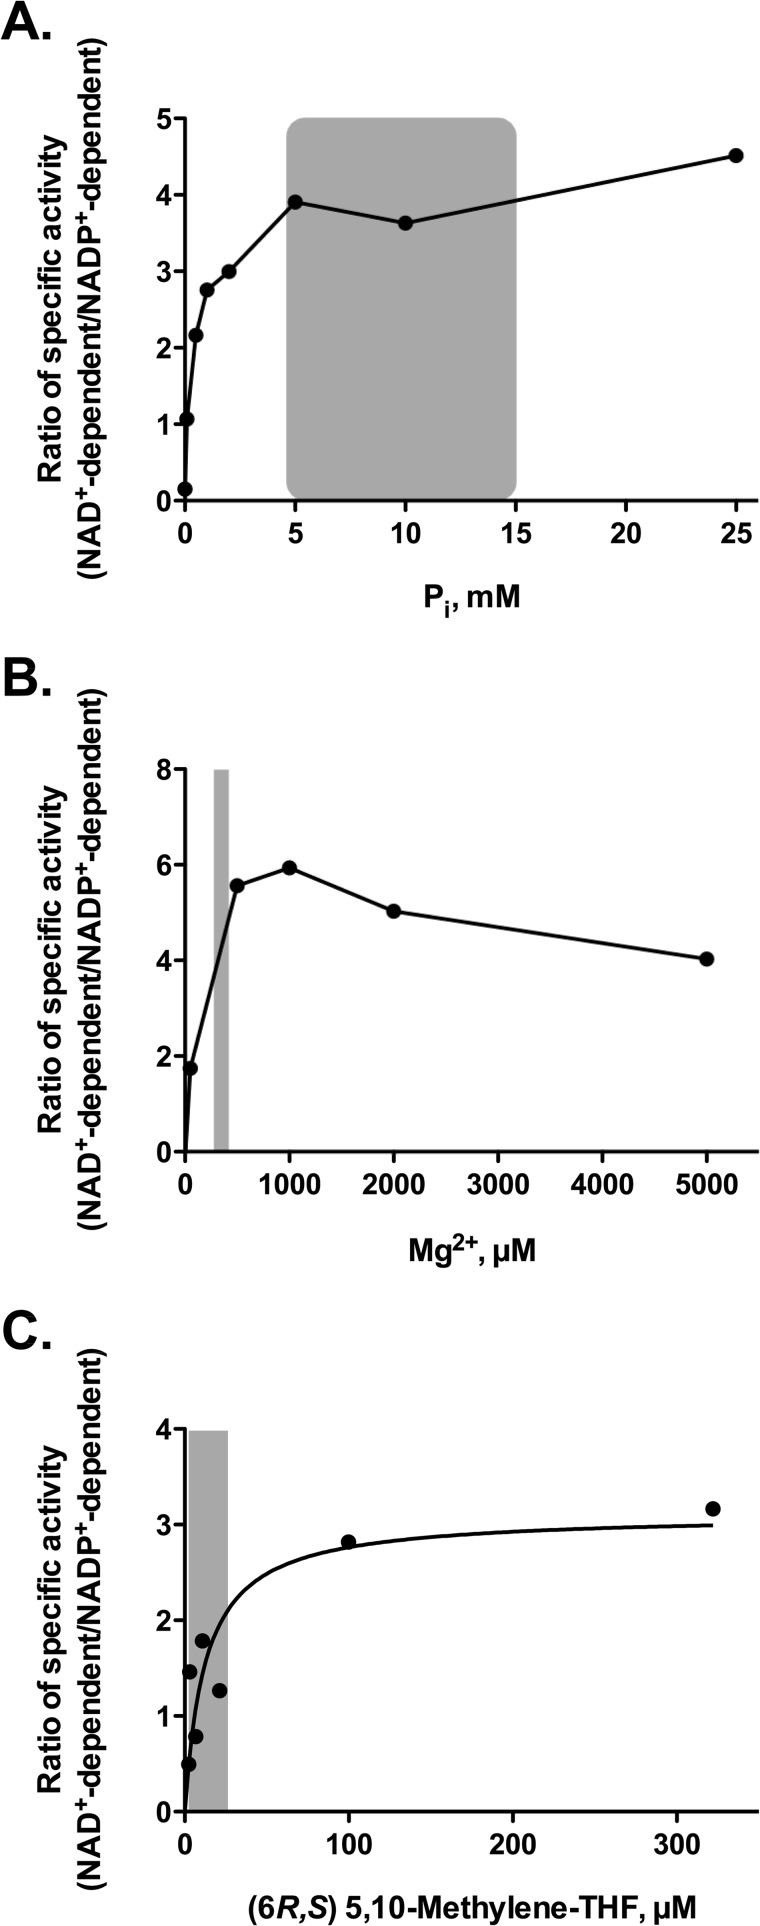
FIGURE 4.
Redox cofactor specificity of MTHFD2L at physiological concentrations of Pi, Mg2+, and 5,10-CH2-THF. The ratio of NAD+- to NADP+-dependent 5,10-methylene-THF activity was plotted as a function of increasing concentrations of inorganic phosphate (A), Mg2+ (B), or 5,10-CH2-THF (C). Reaction buffer (described in the legend for Fig. 3) contained either 1 mm NAD+ or 6 mm NADP+. 5,10-CH2-THF was included at 0.4 mm (A and B) or varied (C). For dependence on Pi concentration (A), 5 mm MgCl2 was included for both NAD+- and NADP+-dependent reactions. For dependence on Mg2+ concentration (B), 25 mm potassium phosphate was included in NAD+-dependent but not NADP+-dependent reactions. For dependence on 5,10-CH2-THF concentration, 5 mm MgCl2 and 25 mm Pi were included in NAD+-dependent reactions. For the NADP+-dependent reactions, only 5 mm MgCl2 was included. Reported mitochondrial matrix substrate concentration ranges (indicated by shaded areas) are 5–15 mm for Pi (47–49), 0.3–0.4 mm for Mg2+ (48, 49), and 2.5–25 μm for 5,10-CH2THF (37–40), respectively. The best estimates found for in vivo mitochondrial NADP+ and NAD+ concentrations are NADP+ = 80 μm and NAD+ = 240 μm (42, 43). The data in C were fit to the Michaelis-Menten equation. The 5,10-CH2-THF concentration that gave the half-maximal ratio of NAD+- to NADP+-dependent 5,10-methylene-THF activity was 12.5 μm.

