
FIGURE 5.
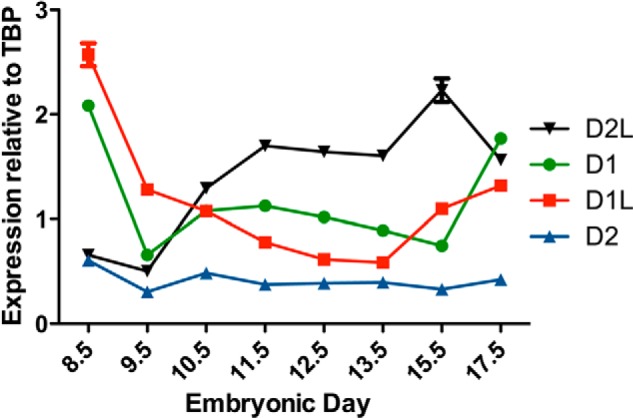
Temporal expression profile of MTHFD gene family in mouse embryos. The relative expression profiles of MTHFD1 (●), MTHFD1L (■), MTHFD2 (▴), and MTHFD2L (▾) was determined by real-time PCR as described under “Experimental Procedures.” The age of the embryos from which the RNA was obtained is indicated in embryonic days (birth occurs at ∼E20.0). mRNA expression was normalized to that of the TBP transcript. Each point represents the mean ± S.E. of triplicate determinations (error bars are included for all data points but are obscured by the data symbol when the scatter is small).