
FIGURE 7.
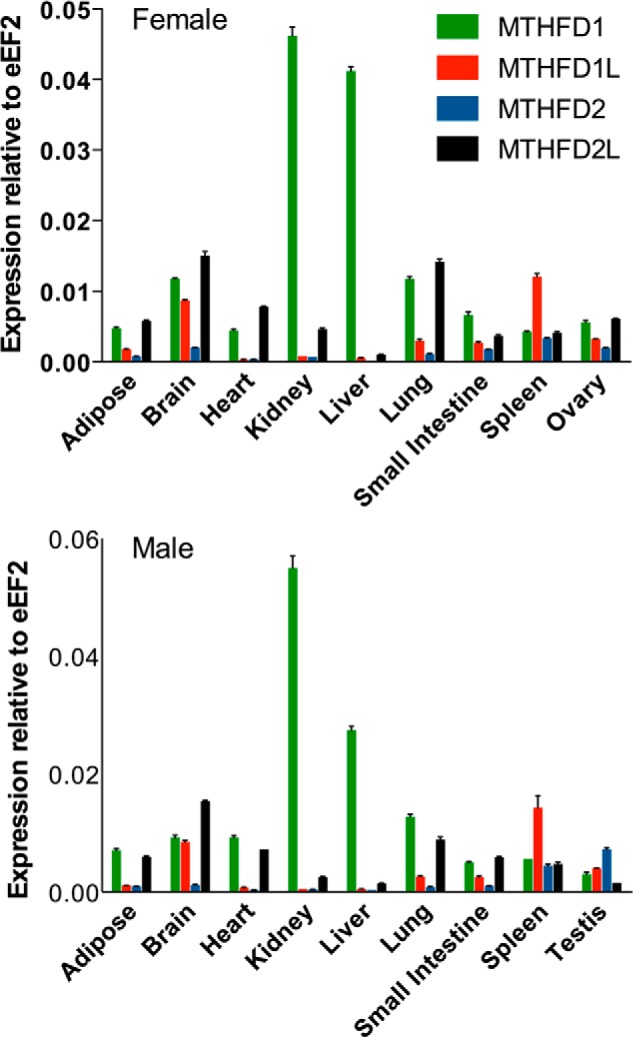
Expression profile of MTHFD gene family in adult mouse tissues. The relative expression profiles of MTHFD1 (green), MTHFD1L (red), MTHFD2 (blue), and MTHFD2L (black) was determined by real-time PCR as described under “Experimental Procedures.” mRNA expression was normalized to that of the eEF2 transcript in female (top) and male (bottom) adult mice. Each column represents the mean ± S.E. of triplicate determinations.