FIGURE 11.
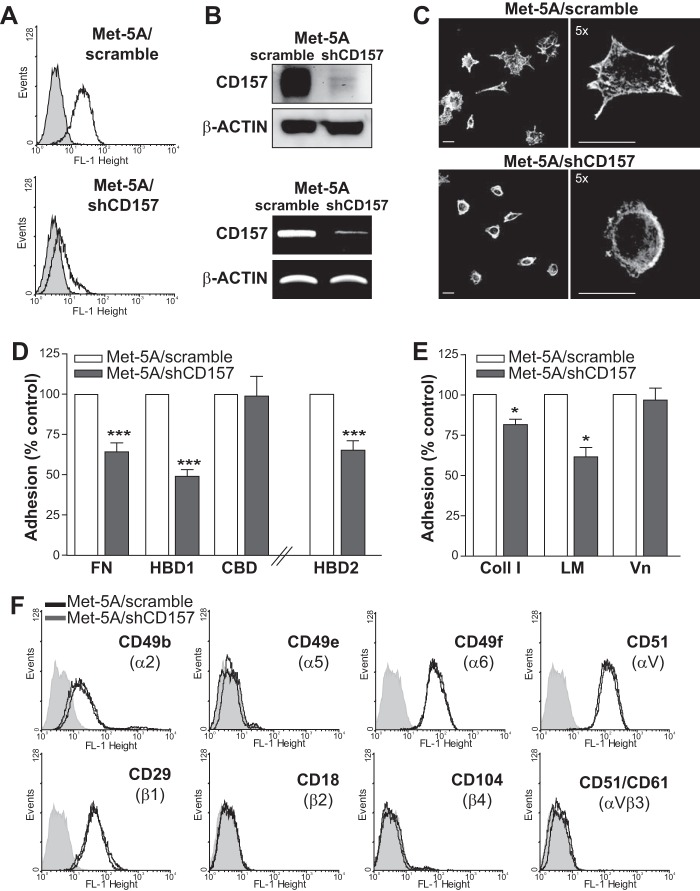
CD157 silencing reduces spreading and adhesion of mesothelial cells to extracellular matrix proteins. A, FACS analysis of Met-5A cells transduced with a CD157-specific shRNA (bottom panel) or a control shRNA (top panel). Cells were stained with the SY/11B5 anti-CD157 mAb (5 μg/ml) (white peaks) or isotype-matched murine monoclonal IgG (gray peaks) followed by F(ab′)2-GαMIg-FITC. Fluorescence was analyzed using a FACSCalibur flow cytometer and CellQuest software. x axis = fluorescence intensity (FL-1 height), y axis = number of cells (events). B, Western blot analysis (top panel) and RT-PCR (bottom panel) of Met-5A cells transduced with a CD157-specific shRNA. β-Actin was used as loading control. C, CD157 knockdown-induced changes in cell morphology and F-actin cytoskeleton. Met-5A/shCD157 and Met-5A/scrambled cells were plated on FN-coated slides in serum-free medium in the presence of cycloheximide, then fixed with 2% PFA, permeabilized with 0.2% Triton X-100, and stained with TRITC-labeled phalloidin. Samples were analyzed by an Olympus FV300 laser scanning confocal microscope. Cells were imaged using a ×60 oil immersion objective (1.4 NA). Scale bars, 100 μm. Microphotographs were reproduced in black and white. D, comparison of the ability of Met-5A/scramble (white histogram) and Met-5A/shCD157 (gray histogram) cells to adhere to 10 μg/ml of FN, HBD1, and CBD-coated plates or 50 μg/ml HBD2. E, adhesion of Met-5A/scramble and Met-5A/shCD157 to Coll I, LM, or Vn-coated plates. Adherent cells were fixed with 4% PFA, stained with 0.5% crystal violet, and counted by light microscopy in five randomly selected fields (×4) for each well. Results are expressed as percentage of controls (number of adherent Met-5A/scramble cells = 100%, white histogram) and represent the mean ± S.E. of three experiments performed in triplicate. ***, p < 0.001; *, p < 0.05, unpaired t test. F, flow cytometric analysis of selected integrins in Met-5A cells transduced with a CD157-specific shRNA (gray peaks) or a control shRNA (black peaks). Cells were stained with anti-CD49b, CD49e, CD49f, CD51, CD29, CD18, CD104, and CD51/CD61 mAbs (5 μg/ml) or isotype-matched murine monoclonal IgG (shaded peaks) followed by F(ab′)2-GαMIg-FITC. Fluorescence was analyzed using a FACSCalibur flow cytometer and CellQuest software. Ten thousand cells were considered for each analysis. x axis = fluorescence intensity (FL-1 height), and y axis = number of cells (events).

