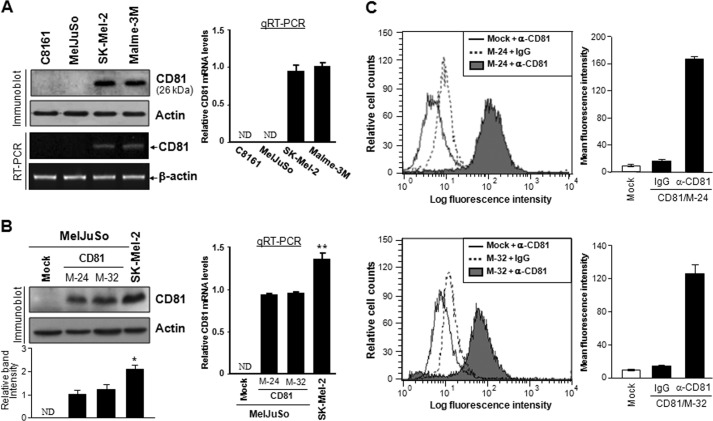
FIGURE 1.
CD81 expression levels in human melanoma cell lines and CD81 transfectant cells. A and B, human melanoma parental cell lines (A) and stable CD81 transfectant clones of MelJuSo cells (B) were examined for CD81 protein levels by immunoblotting analysis. A bar graph under the immunoblot indicates relative band intensity of CD81 normalized to the loading control (actin). CD81 gene expression was also examined by quantitative real time RT-PCR (qRT-PCR) analysis, and relative mRNA levels of CD82 normalized to the GAPDH level are shown in bar graphs next to the immunoblots. Results are the mean ± S.D. from three separate experiments. Error bars represent S.D. C, cell surface expression levels of CD81 in stable CD81 transfectant clones of MelJuSo cells were analyzed by flow cytometry using an anti-CD81 monoclonal antibody. Mean fluorescence intensity of each cell population is shown in a bar graph next to the distribution chart. Values are the mean ± S.D. from three separate experiments with triplicates per experiment (* and **, p < 0.03 versus MelJuSo CD81 transfectant clones; Student's t test). ND, not detectable.

