FIGURE 5.
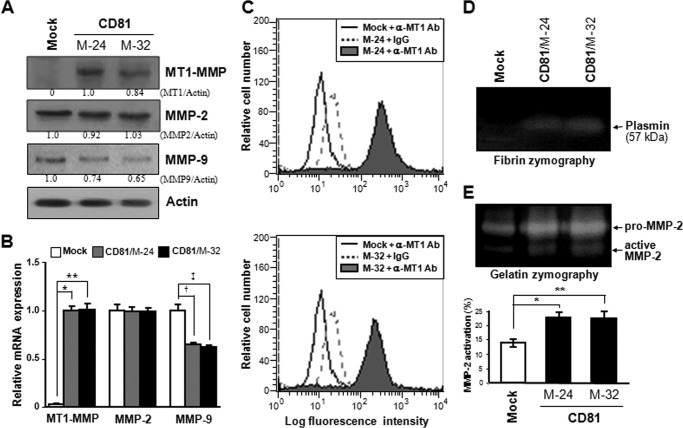
CD81 induces expression of MT1-MMP in MelJuSo melanoma cells. A and B, stable CD81 transfectant clones of MelJuSo cells were examined for protein (A) and mRNA (B) levels of MT1-MMP, MMP-2, and MMP-9 using immunoblotting and quantitative real time RT-PCR analyses, respectively. Numbers under the immunoblot (A) represent relative band intensity of protein normalized to the actin level. A bar graph (B) indicates the relative mRNA levels of genes normalized to the GAPDH level. Values are the mean ± S.D. from three separate experiments with three determinations per experiment (* and **, p < 0.01; † and ‡, p < 0.03). Error bars represent S.D. C, cell surface expression level of MT1-MMP was assessed by flow cytometry using anti-MT1-MMP antibody (Ab). Shown are the representative data of three independent experiments. D and E, enzymatic activity of MT1-MMP in the CD81 transfectant cells was determined by zymographies using fibrin (D) and gelatin (E) as substrates. Proteolytic activation of MMP-2 in gelatin zymography was calculated from the relative band intensity of active MMP-2 to the sum of pro-MMP2 and active MMP-2. Data shown are the mean ± S.D. from three separate experiments with three determinations per experiment (* and **, p < 0.03).

