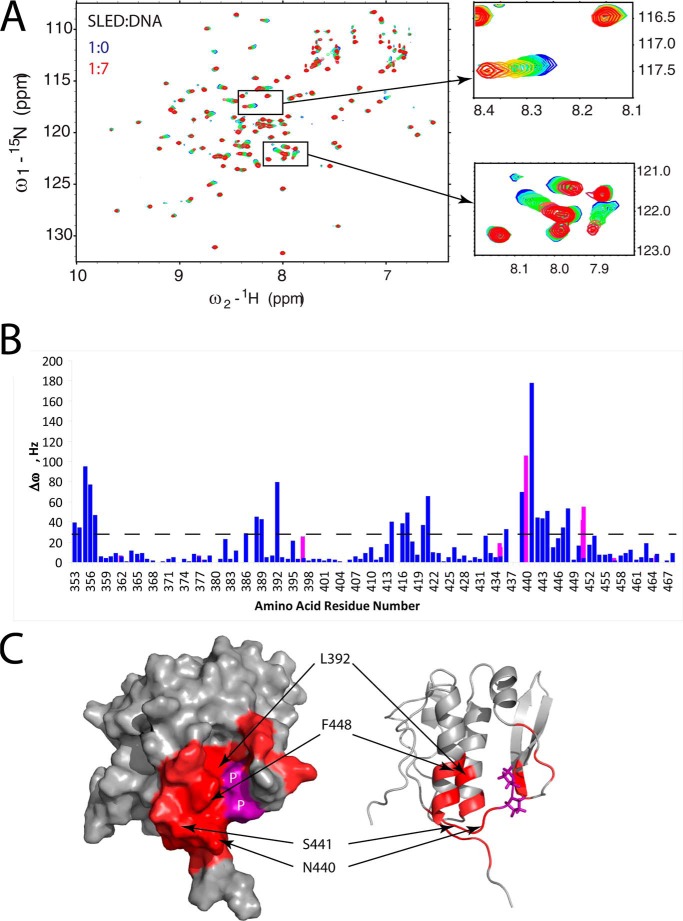
FIGURE 6.
Scml2 SLED domain and dsDNA binding. A, overlay of 15N/1H HSQC spectra of the free (blue) and DNA-bound SLED domain. The two insets show gradual changes in peak positions (from blue to red) in selected spectral regions upon the addition of ASCL1 dsDNA. B, NMR frequency difference Δω = (ΔωN2 + ΔωH2)½ (at 800 MHz for 1H) between the first and the last points of DNA titration for each amino acid residue of SLED are shown as a histogram. Δω values for backbone HN groups are shown in blue, and those for the HN groups of Gln and Asn side chains are shown in magenta. C, SLED amino acid residues that form the DNA-binding site (with Δω values > 30 Hz) are shown in red on a surface representation (left) and ribbon representation (right) of the SLED structure. Selected DNA-binding residues are labeled. Proline residues within the DNA-binding site are shown in purple on the SLED surface and labeled as P. Titration data for proline residues are not available because they are not present in the 15N/1H HSQC spectrum due to a missing HN group in their chemical structure.

