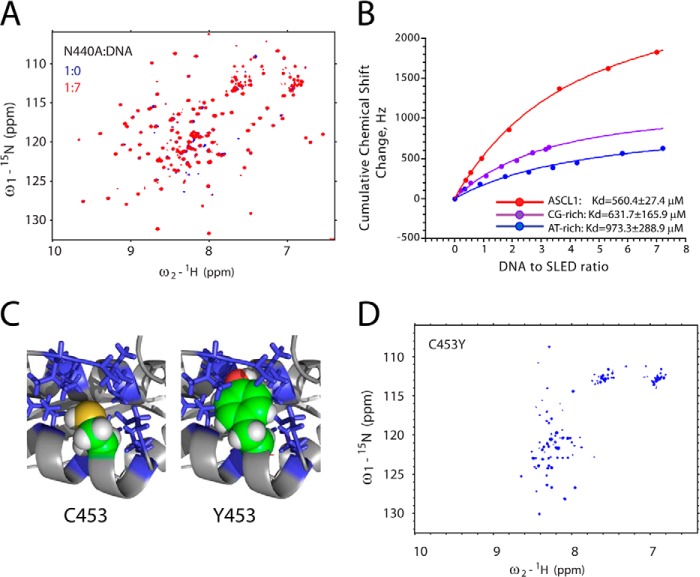
FIGURE 7.
Mutational analysis of Scml2 SLED. A, overlay of 15N/1H HSQC spectra of the free (blue) N440A SLED domain and N440A in the presence of 7 m excess of ASCL1 oligonucleotide (red). B, DNA titration curves derived from the NMR chemical shift perturbation experiments. Cumulative chemical shift changes for all amino acid residues in the domain are plotted as a function of DNA to SLED ratio. Experimental data and fitting curves for three different double-stranded oligonucleotides (dsAGGAGCGGGAG, dsGGGCGCGCCC, and dsTTTATATAAA) are shown in red, purple, and blue, respectively. The resulting Kd values are shown at the bottom of the graph. C, the model of the C453Y mutant of the SLED domain. The packing of the Cys-453 (top) versus Tyr-453 (bottom) side chains within the hydrophobic core is shown. A portion of the protein is shown as a ribbon, and the side chains of the hydrophobic amino acid residues surrounding Cys-453 are shown as sticks. The side-chain atoms of the Cys-453 and Tyr-453 are shown as spheres. D, 15N/1H HSQC spectrum of the C453Y of the Scml2 SLED domain reveals that it is unfolded in solution.

