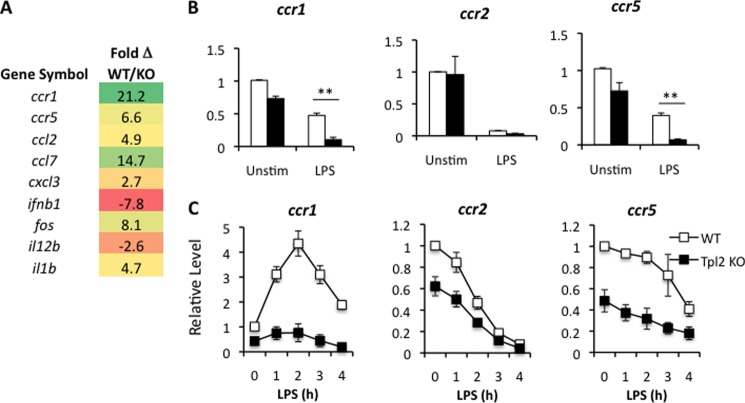
FIGURE 1.
Impaired chemokine receptor expression in tpl2−/− BMDMs. A, BMDMs from WT and tpl2−/− mice were stimulated with LPS (1 μg/ml) for 4 h, and mRNA expression was analyzed by gene chip microarray. Data are presented as the fold change in gene expression in WT macrophages compared with tpl2−/− macrophages. B and C, BMDMs from WT and tpl2−/− mice were stimulated in medium with LPS (1 μg/ml) for either 4 h (B) or the indicated time points (C) and were analyzed for mRNA expression of various CC chemokine receptors by qRT-PCR relative to an actin control. Expression levels at each time point were normalized to the endogenous actin control and were expressed relative to the WT unstimulated (Unstim) control. Results are averaged from three independent experiments, and error bars represent mean ± S.E.

