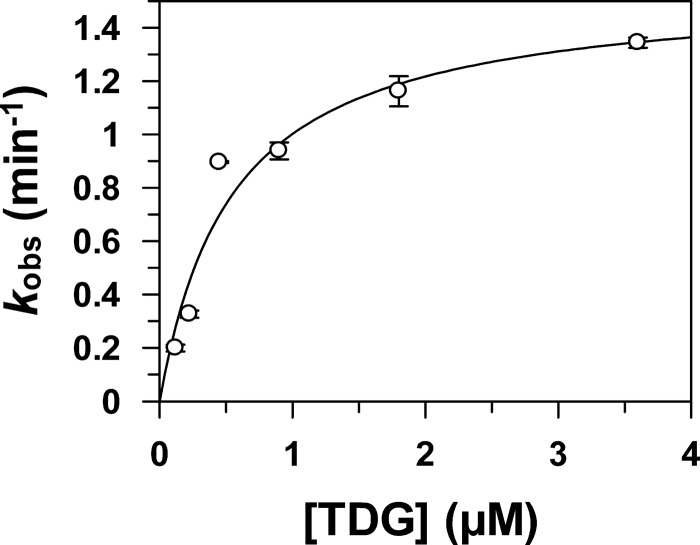
FIGURE 6.
Dependence of modification rate on TDG concentration. Immunoblot analysis of TDG modification by preformed E2∼SUMO-1 was performed in the absence of DNA at TDG concentrations of 0.12 μm, 0.23 μm, 0.45 μm, 0.90 μm, 1.8 μm, and 3.6 μm. The kobs values were obtained by linear regression analysis of at least three time points per experiment. Error bars represent 1 S.D. Where error bars are not visible, they are smaller than the symbols. Data were fitted to a hyperbolic equation, kobs = kmax[TDG]/(K1/2 + [TDG]). The fitting yields kmax = 1.55 ± 0.16 min−1 and K1/2 = 0.55 ± 0.17 μm.

