Fig. 6.

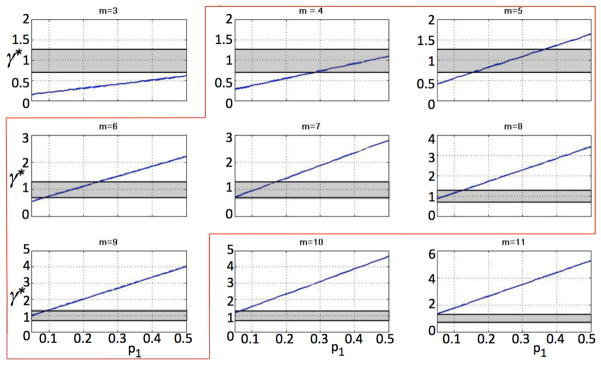
Values of optimal γ* for different p1 for various m. Shaded areas indicate experimentally observed cell cycle times. Highlighted are parameter sets that yield optimal growth rates γ*(p1) within biological observations.

Values of optimal γ* for different p1 for various m. Shaded areas indicate experimentally observed cell cycle times. Highlighted are parameter sets that yield optimal growth rates γ*(p1) within biological observations.