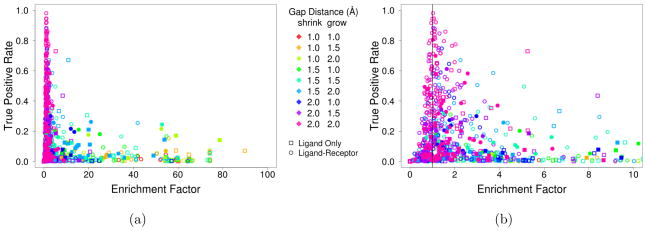
Figure 10.
The enrichment factor and true positive rate (sensitivity) for various shape constraint searches across the 102 targets of the DUD-E benchmark. Both the (a) full results and (b) a magnification of the lower enrichment factor region are shown. All possible shape constraints using just the ligand (see Figure 2) and both the ligand and receptor shapes (see Figure 3) with gap sizes of 1, 1.5, and 2 Å for the minimum and maximum constraints were considered. Solid marks correspond to the shape constraint search that had the highest F1 score for a given target. Enrichment factors greater than one indicate better than random performance.

