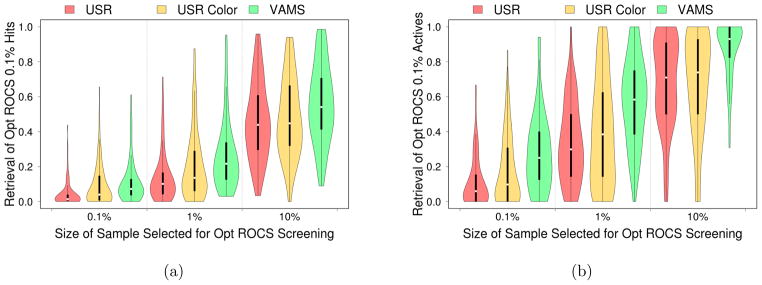
Figure 14.

Distribution of retrieval rates of the top color-optimized ROCS (a) hits and (b) actives if faster methods of shape comparison are first used to produce a smaller library. The ability of these methods to retrieve the identical molecular conformations ranked in the top 0.1% for each benchmark is measured. When measuring retrieval of the conformations of active compounds in this top 0.1%, one benchmark is omitted since color-optimized ROCS did not rank any actives this highly. Despite lacking color information, VAMS produces better retrieval rates than USR with color information. Violin plots show the median value (dot), the range between the first and third quartile (solid block line), and the kernel density from the minimum to maximum values (shaded area).
