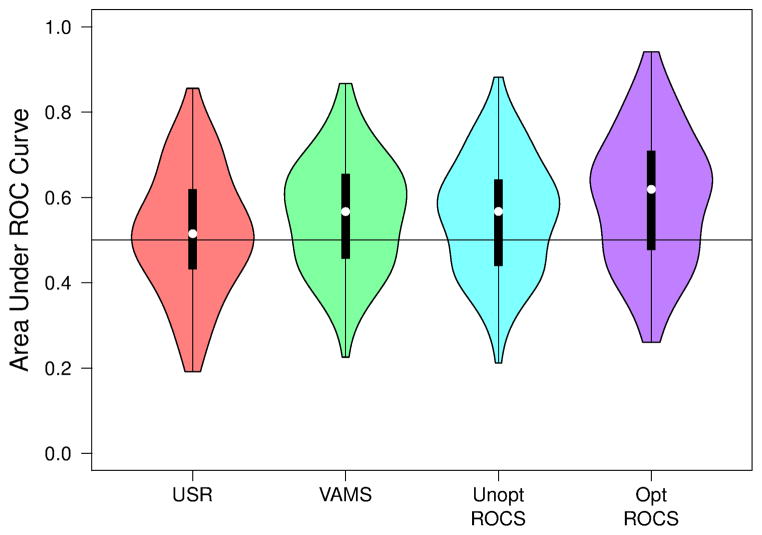
Figure 5.
The distribution of the area under the curve (AUC) of the receiver operating characteristic (ROC) curves of various shape-based virtual screening algorithms when applied to all 102 targets in the DUD-E benchmark. An AUC of 0.5 indicates random performance while an AUC of 1.0 indicates a perfect ranking of active ligands. Violin plots show the median value (dot), the range between the first and third quartile (solid block line), and the kernel density from the minimum to maximum values (shaded area).

