Figure 3.
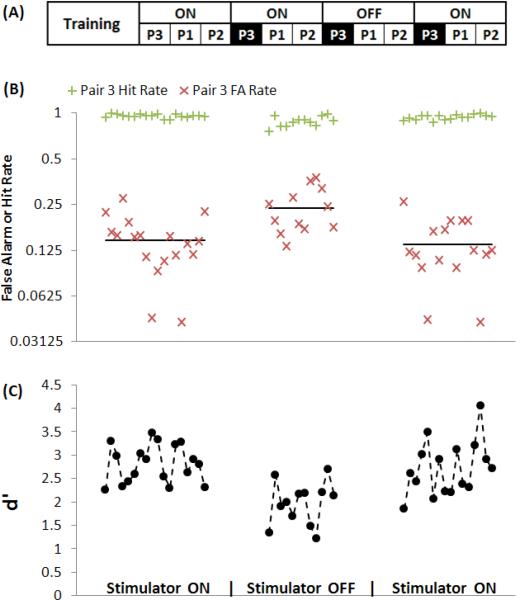
Example of stimulator turn-off effect on performance of cat C4. A: Experimental time-line. Each block (P1, P2, and P3) represent 9 to 11 days of different pairs of tones (1, 4, and 7 kHz reference) presented throughout the experiment. B: Hit and FA rates for 3 different periods of testing at 7 kHz reference frequency (pair 3, 2.8 & 7 kHz) which was presented at times marked in A. Each point is cumulative calculation of 100-trial window. Solid lines represent FA average of each period. C: Performance represented by d’, calculated from hit and FA rates in B. Increase in FA causes reduction of d’ which means reduction in frequency discrimination ability.

