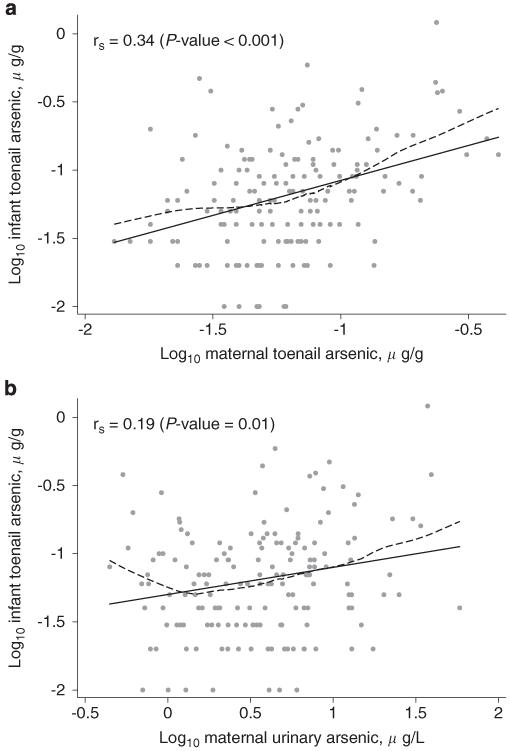
Figure 1.
The relationship between log10-transformed infant toenail arsenic concentration and maternal biomarkers including log10-transformed maternal toenail arsenic concentration (a) and log10-transformed maternal urinary arsenic concentration (b). In both panels, the rs represents Spearman’s correlation coefficient, the black line represents least-squares regression, and the dashed line represents LoWeSS (locally weighted scatterplot smoothing) moving average fitted curve.

