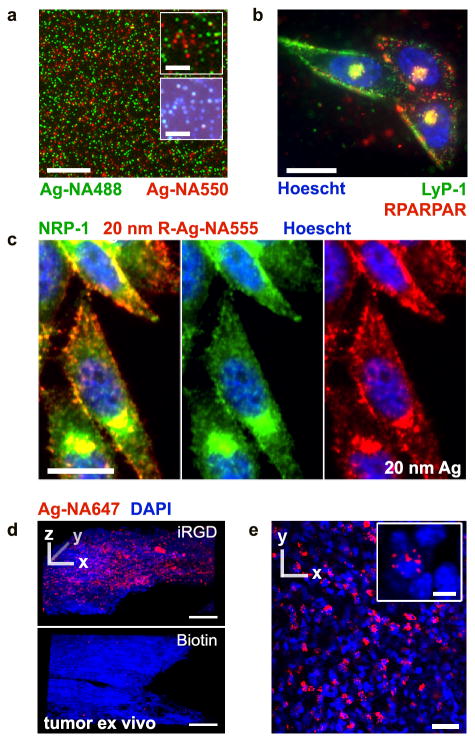
Figure 5. Distinguishing individual AgNPs of different colors, in cancer cells and tumors.
(a) Microscopy analysis of a mixture of Ag-NA488 (green) and Ag-NA550 (red) on a glass slide, 20× objective. Insets show single nanoparticle detection in epifluorescence (upper) and color darkfield (lower). (b) PPC-1 cells were incubated with the mixture of green and red Ag-NA, carrying Lyp-1 and RPARPAR peptides, respectively. The difference in binding between cells reflects receptor specific binding, with colocalization in endosomes occuring near the nucleus (Hoescht, blue), 100× objective. (c) Smaller 20 nm R-Ag-NA555 (red) imaged by epifluorescence after incubation with PPC-1 cells and counterstaining with anti-NRP-1 antibody, Alexa Fluor 488 secondary antibody (green), and Hoescht. (d) Living tumor slices of 200 μm thickness were prepared from resected tumors and cultured in media. Confocal laser microscopy was performed after incubation and etching of (top) iRGD-Ag-NA647 or (bottom) biotin Ag-NA647 as a non-peptide control. Strong internalization was seen with iRGD. Z-stacks were collected through 60 μm total thickness, step size 2 μm, 20× objective. (e) 2D slice from d, top, for iRGD-Ag-NA647. Inset shows the perinuclear localization in red, 40× objective. Scale bars are 25 μm except in a-inset 5 μm, d 100 μm, and in e-inset 5 μm. DyLight 488 and 550 were used in a and b, CF555 in c, and CF647 in d.

