Fig. 1.
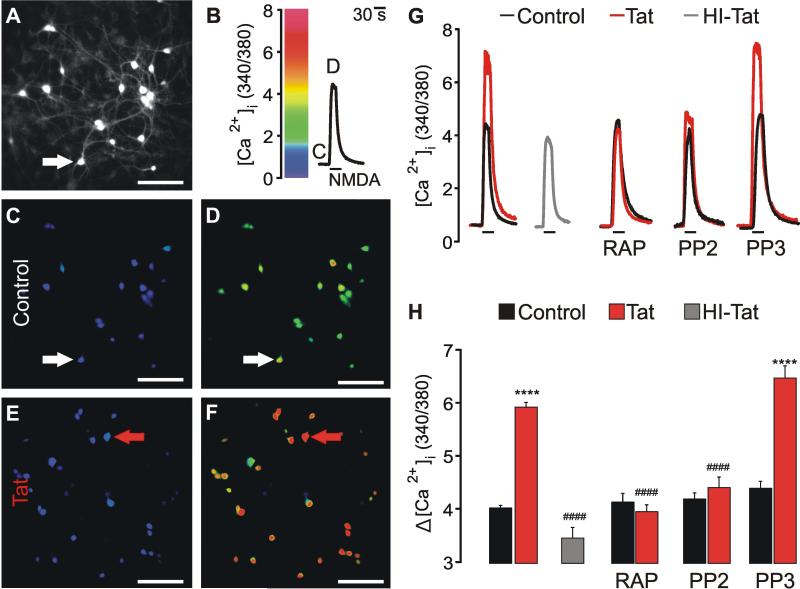
HIV-1 Tat potentiates NMDA-evoked [Ca2+] responses via LRP and a SFK. [Ca2+]i was recorded using fura-2-based digital imaging (Methods). A, representative image shows fura-2 loaded neurons (scale bar = 100 μM). B, trace shows change in [Ca2+]i expressed as 340 nm / 380 nm intensity ratio for the cell identified by the arrow in A. Cells were superfused with 100 μM NMDA (30 s) at the time indicated by the horizontal bar. C-F, pseudocolor images show [Ca2+]i before (C, E) and during (D, F) 30 s application of 100 μM NMDA for control (C, D) and Tat treated (100 nM × 40 min; E, F) cells. Images were scaled as shown in B. Images were collected at times indicated by the letters annotating the traces in B. G, representative traces show NMDA-evoked [Ca2+]i increases for control  cells, Tat-treated cells
  , and cells treated with heat-inactivated (HI) Tat
  . Control
  and Tat-treated
  traces were from the cells indicated by the arrows in C-D and E-F, respectively. Cells were pretreated for 1 h prior to Tat application with 50nM RAP, 10 μM PP2, or 10 μM PP3 as indicated. H, Bar graph shows net [Ca2+]i increase evoked by 100 μM NMDA in control
  cells, cells treated with 100 nM Tat
  , or 100 nM heat-inactivated (HI) Tat
  for 40 min. Cells were pretreated with 50nM RAP, 10 μM PP2, or 10 μM PP3 as indicated. ****p<0.0001 relative to respective control; ####p<0.0001 relative to Tat alone as determined by one-way ANOVA with 9 levels followed by Tukey's post-test for multiple comparisons.

