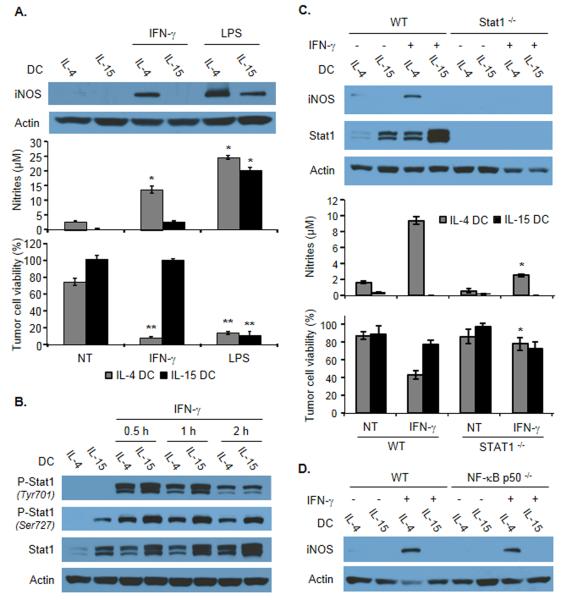
Figure 3.
iNOS expression and role of STAT-1 and NF-κB in IFN-γ-activated IL-4 DCs or IL-15 DCs. (A) Detection of iNOS expression by immunoblotting in total cell extracts of IL-4 DCs or IL-15 DCs treated as indicated (top), corresponding concentration of nitrites in the cultures (middle), and tumor killing activity of DCs in the indicated conditions (bottom). Data are shown as mean ± SD of duplicates (middle) or triplicate wells (bottom) from one representative experiment out of three performed. *p<0.02; **p<0.001, compared with the corresponding untreated DC group, Student t test. (B) Analysis of the phosphorylation of STAT-1 by immunoblotting in total cell extracts of IL-4 DCs or IL-15 DCs at the indicated time points following IFN-γ exposure. Data shown are representative of four experiments performed. (C) Detection of iNOS expression and STAT-1 phosphorylation by immunoblotting in total extracts of IL-4 DCs or IL-15 DCs generated from WT or from STAT-1−/− mice and treated or not with IFN-γ (top), corresponding concentration of nitrites in the cultures (middle), and tumor killing activity of the DCs in the indicated conditions (bottom). Data are shown as mean ± SD of duplicates (middle) or triplicate wells (bottom) from one representative experiment out of three performed. *p<0.02, compared with IFN-γ-treated WT IL-4 DC group, Student t test. (D) Detection of iNOS expression by immunoblotting in total extracts of IL-4 DCs or IL-15 DCs generated from WT or from NF-κBp50−/− mice and treated with IFN-γ as indicated. Data shown are representative of three experiments performed. (A-D) β-actin was used as a loading control.

