
Figure 1.
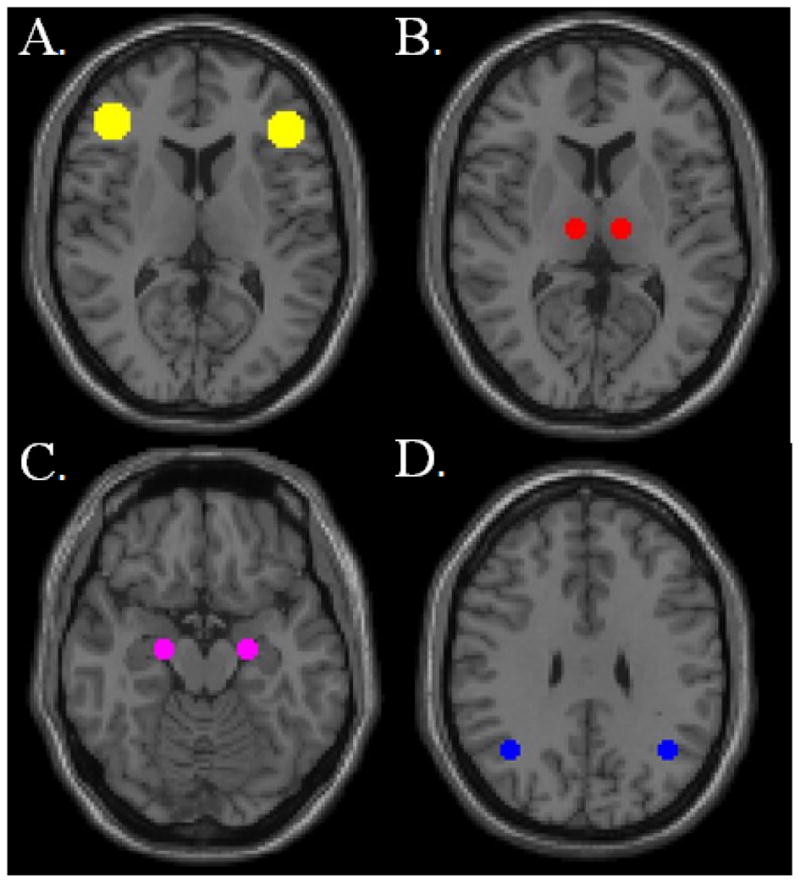
Visualization of regions of interest (ROIs) used to calculate average network interhemispheric functional connectivity (IH-FC). (A) dorsolateral prefrontal cortex (DLPFC) (B) thalamus (C) medial temporal lobe (MTL) and (D) lateral parietal lobe. ROIs are overlaid on MNI template.